
The Problem Of Creating A Single Education Environment In Russian Macroregions


Abstract
The article describes relative features of all levels and stages of education: preschool, school, and basic, secondary, and higher professional education in Russian macroregions in order to identify proportions (disproportions) of their development and opportunities for building a single, proportionate education environment throughout the Russian Federation. Such an environment is based on federal projects aimed at implementation of the National Project for Education. They are projected to contribute to further development of a competitive new-generation national economy: a knowledge-intensive economy. A 2018 analysis of specific indicators of education environments in Russian macroregions identified two types of proportions and disproportions: first, between the share of students at each level of education (from preschool to higher) in the total population and, secondly, between the shares of students at each stage and level of education in the total number of students in the macroregion, which can be called the capacity of an education environment.
Keywords: Education environment, proportionality, national project, stages of education, knowledge-intensive economy
Introduction
The second-generation industrial society as a whole is a development stage of physical production that follows the service-based stage of economy. It is characterised by high knowledge intensity of technologies, expansion of knowledge-based production within all sectors and activities, continuous innovation, and a high degree of integration between production, science, and education.
Problem Statement
Implementation of the National Project for Education raises a number of theoretical and practical questions.
An analysis of scholarly papers (Bodrunov, 2018; Ivanova, 2014; Meshcheryakova, 2014; On the way to noonomics:…, 2020; Ovchinnikova, 2017; Yakushkina & Ilakavichus, 2016) shows that the problem of creating a single education environment in macroregions is not sufficiently studied, which makes it a promising area of future studies. In particular, we observe an uneven and disproportionate distribution of the education environment in Russian macroregions.
Research Questions
The study considers the following questions:
- What is the state of all levels and stages of education in Russian macroregions?
- Are there any disproportions in development of those levels and stages?
- Is it possible to build a single, proportionate educational environment throughout Russia?
Purpose of the Study
Answers to the questions are meant to help solve the problem of building a single, proportionate educational environment based upon setting further strategic goals, implementation criteria, and planning to improve the proportionality and reduce the irregularity in development of the educational environment in Russian macroregions.
Research Methods
Comparative analysis of specific indicators was used as the main research method. Data from annual statistical reports on Russian regions served as the information base for the comparative analysis. We therefore chose the indicators describing the population as a demographic macro-environment and as a part of the cultural macro-environment of education (Federal State Statistic Service, 2020). The absolute quantitative indicators in Sections 1 (Population) and 5 (Education) were used to obtain relative ones to be compared for the purpose of analysing the education environments in the Central, North-Western, Southern, North Caucasian, Volga, Ural, Siberian, and Far Eastern Macroregions. The main principle to describe the state of an educational environment is proportionality (Babkina & Skotarenko, 2013; Skotarenko & Babkina, 2013).
Findings
The main theoretical principles of the study – proportionality and regularity – are used in the comparative analysis of different levels and stages of education in Russian macroregions. The principles are applied for the purpose of identifying disproportions and irregularities in development of the education environment. Eliminating those will help solve the problem of building a single, proportionate, and steadily developing education environment.
We used two methods to identify the degree of proportionality (disproportion).
The first method was to calculate specific and relative indicators for each region: first, in the quantitative value (total amount or volume) of indicators describing Russia as a whole, secondly, in the total quantitative value of indicators describing the total number of students at each level and stage of education in each macroregion.
The second method was to compare benchmark indicator proportions with each other, e.g. the share of the number of students at each level and stage of education with their total number in Russia and in each macroregion.
We will describe the education environment at three levels of it. The first level is preschool education; the second level is school education. The third, fourth and fifth levels are professional education: basic, secondary, and higher.
We will start analysing the first level of the education environment by describing the following features: the share of preschool students in each macroregion in their total number in Russia and the share of preschool students in the total population of the macroregion. The maximum share of preschoolers in their total number in Russia was 23.04% in the Volga Macroregion in 2018. The smallest share, equal to 5.68%, was in the North Caucasian Federal District, which is 4.1 times lower than in the leading macroregion. The Central Macroregion takes up 19.2%, Siberia 12.82%, and Urals 11.43%. The Southern and North-Western Macroregions take up similar shares, 10.77% and 10.71%, respectively. The Far East Federal District holds the penultimate place, where the share of preschoolers in their total number in Russia was 6.43%.
A comparison of the population number with the share of preschool students as well as the indicator “Net preschool enrolment ratio, percentage in the number of children aged 1–6” shows that the first places are held by the North-Western and Ural Federal Districts, with their respective enrolment ratios of 76% and 75.9%. These macroregions are 8.8% and 8.7% above the Russian average value (67.2%). The Volga Macroregion (72.1%) is also above the Russian average by 4.9%. The Southern Macroregion has the average value (67.2%). The Central, Siberian, and Far Eastern regions have below-average values of 66.5%, 66.2%, and 66.3%. These indicators differ from the average value by 0.7%, 1%, and 0.9%. The last position with the lowest net enrolment ratio is held by the North Caucasian Federal District, where the indicator value was 46.5%, 1.63 times (29.5%) lower than that of the North-Western regions, the difference from the average value being 20.7%.
The calculated share of preschool students in the total population of each region showed that the largest share in 2018 was observed in the Ural Macroregion (6.19%). The smallest share was in the Central Macroregion – 3.24 %, which is 1.91 times lower than in the leading macroregion. Above-average (4.55%) places are held by four macroregions: Far East (5.25%), Volga (5.24%), North-West (5.12%), and Siberia (4.99 %). The North Caucasian Macroregion holds a below-average place, with its share of preschoolers equal to 3.85%, which differs from the lowers value of the Central Federal District by 0.61%.
A comparative analysis of the calculated indicator of the “share of preschool students” by region in the total for this category in Russia with the “share of the population in the total Russian population” made it possible to conclude that the most significant disproportion was observed in the Central Macroregion, where the share of preschoolers was smaller than the share of the population by a factor of 1.4 or by 7.71%. A share of preschoolers exceeding the share of the regional population by more than 1% was observed in Ural (3.02), Volga (3.01), North-Western (1.19), and Siberian (1.12) Macroregions. A negative deviation of slightly over 1% existed in the North Caucasian Federal District (-1.04). An insignificant deviation was observed in the Southern Federal District (-0.44). Such a comparison of proportions shows an uneven development of preschool education in Russian macroregions. It depends, among other things, on the demographic situation and requires setting additional goals and planning specific activities within the National Project for Education since preschool education can be considered the first level of education as a whole and the first step towards building a single, uniform education environment in Russia.
The next group of indicators describes the second level: school education. The group includes the share of students enrolled on primary, basic, and secondary education programmes in each Russian macroregion in the total number of such students in Russia, the share of students enrolled on primary, basic, and secondary general education programmes in the population of the macroregion, the share of students holding a certificate of basic general education in each macroregion in the number of students holding those certificates in Russia, the share of students holding a certificate of basic general education in the number of students enrolled on primary, basic, and secondary education programmes in each macroregion, the share of students holding a certificate of basic general education in each macroregion in the number of such students in Russia, and the share of students holding a certificate of basic general education in the number students enrolled on primary, basic, and secondary education programmes in each macroregion.
An analysis of the position of macroregions by share of students enrolled on primary, basic, and secondary education programmes in the total number of such students in Russia as a whole showed that the maximum share was observed in the Central Federal District (23.65%) and the minimum share in the Far East Macroregion (6.38%), which is 3.71 times lower, although the difference in the population share was by a factor of 4.81. The other macroregions examined by this indicator were distributed in descending order as follows: Volga (19.79%), Siberia (12.93%), South (11.19%), Urals (9.24 %), North-West (8.78%), and North Caucasus (8.04 %).
The second indicator – the share of students enrolled on primary, basic, and secondary education programmes in the population of the macroregion – showed that the largest share of 13.15% belonged to the North Caucasian Federal District and the smallest share of 9.69% to the Central Federal District, reflecting the demographic situation. The difference is by a factor of 1.357 or by 3.46%. The average position is held by the Southern (10.97%) and Volga (10.86%) Macroregions. Above-average positions are held by three regions: Far East, Siberia, and Urals, with the indicator values of 12.57%, 12.15%, and 12.07%. The North-Western Macroregion with its indicator value of 10.15 % holds a below-average position, close to the lowest one.
Thus, the differences between the population shares and the shares of students enrolled on primary, basic, and secondary education programmes in each macroregion made it possible to divide the macroregion into groups.
The first group includes the macroregions with a positive deviation of the share of students from the share in the population by more than 1%: Far East (+6.99), North Caucasus (+6.43), and Urals (+3,66).
The second group includes the macroregions with insignificant deviations under one percent, both positive and negative: North-West (+0.63), Siberia (+0.45), and South (-0.24).
The third group includes the macroregions with negative deviations: Centre (-17.14) and Volga (-9.17). Consequently, only three macroregions out of eight have a development of the second-level educational environment proportionate to the population.
The third, fourth, fifth and sixth indicators demonstrate the quality of the education environment and development opportunities for its higher levels: the third, fourth, and fifth.
For instance, the share of students holding a certificate of basic general education in each macroregion in the number of students holding those certificates in Russia is generally consistent with the indicator of the share of students enrolled on primary, basic, and secondary education programmes. The positive or negative difference does not exceed 1%. For example, the share of students enrolled on education programmes exceeding the share of students holding a certificate of basic general education is observed in the following macroregions: Centre (0.1), North Caucasus (0.26), Urals (0.14), and Siberia (0.42). In the other four macroregions, on the contrary, there is a slight excess in the share of students holding a certificate of basic general education over the share of students enrolled on primary, basic, and secondary education programmes. Those are the North-Western (0.05%), Southern (0.99 p.p.), Volga (0.59 p.p.), and Far Eastern (0.03 p.p.) Federal Districts.
The fourth indicator is the share of students holding a certificate of basic general education in the number of students enrolled on primary, basic, and secondary education programmes in each macroregion. The average value throughout Russia was 8.46%. The maximum value was observed in the Volga Macroregion (8.71%), the minimum (8.18%) in the North Caucasian and Siberian Macroregion, the difference being just 1.065 times or 0.53%. In the other macroregions, the value of this indicator varied between 8.65% and 8.33%, i.e. within a margin of 0.32%, and reflected the similar proportionality of the share of those receiving a certificate of basic general education in the overall indicator: number of students enrolled on primary, basic, and secondary education programmes in all macroregions.
The fifth indicator is the share of students holding a certificate of basic general education in the number of such students in Russia as a whole. The largest share of 26.38% is in the Central Macroregion, the smallest (6.18%) in the North Caucasus, which is less than in the Central Macroregion by a factor of 4.27 or by 20.2%. The second, third and fourth positions (between 10% and 20%) are held by the Volga (19.15%), Siberian (13.0%), and Southern (10.32%) Macroregions. The share in the other three macroregions is below 10%: North-West (9.28%), Urals (8.79%) and Far East (6.9%). These values are comparable to the proportions of macroregions’ population shares in the total Russian population.
The sixth indicator is share of students holding a certificate of basic general education in the number students enrolled on primary, basic, and secondary education programmes in each macroregion. The average value in Russia is 4.01%. The maximum value of 4.48% was observed in the Central Macroregion, the minimum value of 3.08% in the North Caucasus. The difference was 1.45 times or 1.4%. The Siberian Macroregion held the middle position, with the indicator value of 4.04%. Two macroregions – Far East and North-West – were above average, with their respective values of 4.34% and 4.24%. The other federal districts – Volga, Urals, and South – were below average, their shares being 3.88%, 3.82%, and 3.7%.
The next, seventh and eighth, indicators describe two stages of the third level of the education environment, which was called professional education: the number of students enrolled on vocational training programmes per 10,000 people and the number of students enrolled on secondary professional training programmes per 10,000 people.
A comparative analysis of the seventh indicator values showed that the highest number of vocational training students, as a specific value, was observed in the Far Eastern Federal District: 48 people. The lowest number – 27 people – was in the Central District, which is different by a factor of 1.78. The average value for those programmes in Russia was 37 students per 10,000 people. The North-Western (38 people) and Ural (39 people) Macroregions were close to the average value. Above-average positions are held by the Siberian (45 people), Southern (44 people), and Volga (41 people) Macroregions. The value was below average in the North Caucasian Macroregion: 29 people.
The eighth indicator is the number of students enrolled on secondary professional training programmes per 10,000 people in the macroregion. The Russian average is 168 people. The maximum value is found in the Far Eastern Region (196 people) and the minimum in the Central Region (134 people), which is 1.46 times lower that in the leading region. It is obvious that the situation is consistent with the share of students enrolled on vocational training in the same macroregions. The only difference is that the number of students in secondary professional schools is larger than in vocational schools by a factor of 4.08 in the Far Eastern Macroregion and by a factor of 4.96 in the Central Macroregion. In Russia, the number of students enrolled on secondary professional training programmes is larger than the same indicator for vocational school students by a factor of 4.54 on average. In five regions, the indicator for secondary professional training is above average: Urals (189 people), Siberia and Volga (187 people each), North Caucasus (179 people), and South (172 people). These indicators are higher than the number of students enrolled on vocational training programmes in the same macroregions, by a factor of 4.85 in the Ural Region, 4.16 in Siberia, 4.56 in the Volga Region, 6.17 in the North Caucasus, and 3.91 in the Southern Region. In the North-Western Federal District, the indicator in question is 152 students enrolled on secondary professional training programmes, which is just 1.13 times higher than in the Central Region. However, the indicator is 4 times higher than the number of vocational school students in the same macroregion.
The analysis has shown that the biggest difference between the number of students enrolled on secondary professional training programmes and the number of vocational school students was observed in the North Caucasian Macroregion: by a factor of 6.17.
The next group includes two indicators (the ninth and tenth) and describes the development of higher education in macroregions. Those are the share of students enrolled on Bachelor’s, Specialist’s, and Master’s programmes in their number in Russia and the share of students enrolled on Bachelor’s, Specialist’s, and Master’s programmes in the population of the macroregion.
A calculation of the ninth indicator has shown that it is the highest in the Central Macroregion, with 30.92% of the total number of those enrolled on Bachelor’s, Specialist’s, and Master’s programmes. The smallest share of students is observed in the Far Eastern Macroregion (4.67%), which is 6.62 times lower than in the Central Macroregion. The share in the Volga Macroregion was 19.91%, 1.55 times lower than in the Centre. Siberia has a share of 11.81%, and the North-Western and Southern Macroregions had 10.06% and 10.05%, which is lower than the Central Macroregion value by a factor of 2.62, 3.07, and 3.08, respectively. In the Ural and North Caucasian Macroregions, the indicator values are 7.43% and 5.15%, which is lower than in the Centre by a factor of 4.16 and 6.0.
A calculation of the tenth indicator – the share of higher-education students in the population of the macroregion – has shown the average value in Russia is 2.84%. The highest value of 3.27% is observed in the Central Macroregion, the lowest in the North Caucasus (2.17%), the difference being by a factor of 1.51 or 1.1%. In the other macroregions, the share of higher-education students varied between 2.995% and 2.335 %, within the range of 0.62%, i.e. less than 1 %.
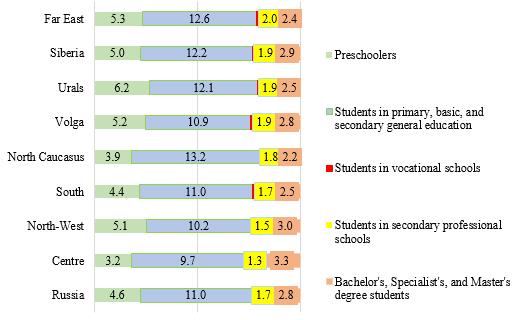
The structure of the education environment is shown in Figure 1.
It is seen in Figure 1, the most uneven and unbalanced education environment is observed in the Central Macroregion. Besides, in the so-called professional education, the smallest share belongs to the number of students enrolled on the first (basic) stage of the third (professional) level of education, and the largest share belongs to the third stage of the level, i.e. higher education.
A comparative analysis of the shares of students at each stage of professional education – basic, secondary, and higher – in the population of each macroregion has been done by converting the number per 10,000 people into a percentage for the respective training programmes: vocational and secondary professional (Table 1). Apart from that, two more indicators are added to Table 1: the share of preschoolers in the total population of the macroregion and the share of students enrolled on primary, basic, and secondary general education programmes as a percentage of the population of the macroregion.
As seen from Table 1, the share of preschoolers in the population was the basis for building a single education environment in Russia in 2018. We can then speak about a proportion where the number of students in primary, basic, and secondary general education is 2.42 times larger than the share of preschoolers. We can conclude that a significant share of the preschool-age population in excluded from the common education environment.
The sizes of shares at the professional education stages – vocational, secondary professional, and Bachelor’s, Specialists’, and Master’s – make up an inverted pyramid. The share of students in basic (vocational) professional education is the smallest, equal to 0.37 %. The share of the next stage – secondary professional education – is 1.68%, which is 4.54 times larger than in vocational training. Finally, the share of students at the third stage of professional education – Bachelor’s, Specialists’, and Master’s degrees – is 2.84% of the total population in Russia. Such a proportion shows that the number of higher-education students is larger by a factor of 7.68 and 1.69 than the respective shares of students in vocational schools (first stage) and students in secondary professional schools (second stage).
The proportions by macroregion identified during the study are shown in Figure 2.
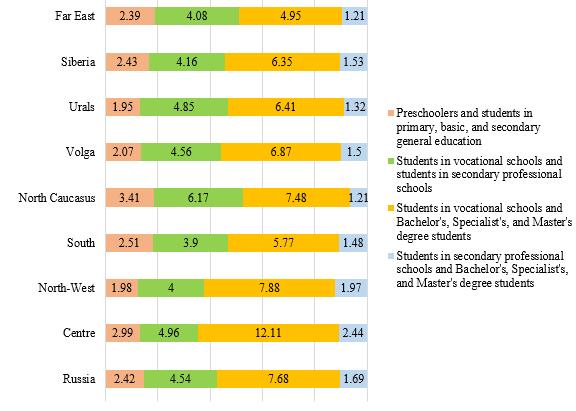
If the share of a level of education is used as a benchmark, the values in Figure 2 show the factor of other levels and stages of education relative to the benchmark.
For instance, the first value is the ratio of the share of students enrolled on primary, basic, and secondary general education programmes to the share of students in preschools.
The second and third values are the ratios of the share of students in vocational schools to the share of students in secondary professional schools and to the share of students in Bachelor’s, Specialists’, and Master’s programmes, respectively. The fourth Figure shows the proportion between the share of students in Bachelor’s, Specialists’, and Master’s programmes and the share of students in secondary professional schools.
As seen in Figure 2, the average proportion values are shown for parts of education environment throughout Russia. The most significant disproportion between the shares of preschoolers and school students, 3.41, was observed in the North Caucasian Macroregion. The lowest disproportions, 1.95 and 1.98, were observed in the Ural and North-Western Macroregions.
The North Caucasian Macroregion also leads in disproportion between basic and secondary professional education (6.17), with the lowest disproportions observed in the Southern and North-Western Macroregions, equal to 3.9 and 4, respectively.
However, the most significant disproportion is observed between the shares of vocational education and Bachelor’s, Specialists’, and Master’s programmes, both in macroregions and in Russia as a whole. The maximum disproportion is in the Central Macroregion (12.11), the minimum is in the Far East (4.95), the average for Russia being 7.68.
The last value in Figure 2 shows the proportion between the shares of students enrolled at secondary professional schools and on Bachelor’s, Specialists’, and Master’s programmes. The proportion is 1:1.69 in Russia as a whole, 2.44 (maximum) in the Central Macroregion, and 1.21 (minimum) in the Far Eastern and North Caucasian Macroregions. As seen in Figure 2, the development of the education environment was the most proportionate and balanced in the Far Eastern Macroregion compared to the other macroregions and the least proportionate and balanced in the Central Macroregion.
Thus, in order to reduce the disproportions between different stages and levels of education, development of sectors and activities aimed at building a single education environment in Russia should be the short-term priority.
Knowledge-intensive production and introduction of knowledge-intensive technologies are the mid-term and long-term goals. It is obvious that, apart from high-tech physical production, we have to foster innovative science as well as education and culture.
Conclusion
In an education environment of a macroregion, education creates human resources (staff, qualified workforce). They have new knowledge and implement it in innovative activities. They can create new knowledge, ideas, projects, technologies, and other innovations. They can implement them in production of knowledge-intensive, competitive goods (On education in the Russian Federation, 2012), hence the need to create strategic areas for development of preschool, school, and basic, secondary, and higher professional education in each Russian macroregion, identify the needs for preschools, general-education schools, and professional schools of the three types and the workforce that they are supposed to train in order to provide industries and research institutes with a suitable number of properly qualified employees. Apart from that, we should agree those strategic areas and implementation criteria of the National Project for Education with the goals and criteria of other national projects, such as Science, Digital Economy, Productivity and Employment, and International Cooperation and Exports (On national goals and strategic development objectives of the Russian Federation until 2024, 2018).
The results of the comparative analysis of the shares of students at different levels and stages of education, both in the total number of students and in the total population in Russian macroregions, serve as a basis for those strategic areas and ongoing plans to develop a proportionate, uniform, and balanced education environment.
References
Babkina, L. N., & Skotarenko, O. V. (2013). Using the qualimetric approach in managing a regional economy. News of Science and Technology at Saint Petersburg State Polytechnic University. Economic Sciences. St. Petersburg, 4(175), 45-52.
Bodrunov, S. D. (2018). Noonomics: the trajectory of a global transformation: a monograph, Moscow.
Federal State Statistic Service. (2020). Regions of Russia. Socioeconomic indicators 2019. https://gks.ru/bgd/regl/b19_14p/Main.htm
Ivanova, S. V. (2014). Modern education environment in socio-cultural and geopolitical aspects. Values and Meanings, 2(30), 43.
Meshcheryakova, E. V. (2014). A holistic approach to forming a language education environment. Facets of Knowledge: Electronic Journal of Science and Education of Volgograd State Pedagogical University, 6(33). https:/www.grani.vspu.ru
On national goals and strategic development objectives of the Russian Federation until 2024. (2018). Decree of the RF President of 7 May 2018 No 204. Official website for legal information: https:/www.pravo.gov.ru
On the way to noonomics: people, technologies, and consumer society in an environment of associated production and consumption. (2020). Ed. A.V. Buzgalina & A.I. Kolganov. Moscow, INIR named after S. Yu. Witte.
Ovchinnikova, T. M. (2017). Transformation of the ethnic identity in a multi-ethnic education environment. Omsk State Pedagogical University Herald. Studies in Humanities, 3(16), 35.
Skotarenko, O. V., & Babkina, L. N. (2013). Specifics of the qualimetric approach in regional studies. News of Science and Technology at Saint Petersburg State Polytechnic University. Economic Sciences. 5(180), 161-165.
Yakushkina, M. S., & Ilakavichus, M. R. (2016). Ecology of the education environment in the CIS. Mir obrazovaniya – Obrazovanie v mire. Moskovskiy psikhologo-sotsial'nyy universitet [The world of Education – Education in the World. Moscow University of Psychology and Sociology], 3(63), 83-88.
Copyright information

This work is licensed under a Creative Commons Attribution-NonCommercial-NoDerivatives 4.0 International License.
About this article
Publication Date
25 September 2021
Article Doi
eBook ISBN
978-1-80296-115-7
Publisher
European Publisher
Volume
116
Print ISBN (optional)
-
Edition Number
1st Edition
Pages
1-2895
Subjects
Economics, social trends, sustainability, modern society, behavioural sciences, education
Cite this article as:
Babkina, L. N., Skotarenko, O. V., & Kozin, M. N. (2021). The Problem Of Creating A Single Education Environment In Russian Macroregions. In I. V. Kovalev, A. A. Voroshilova, & A. S. Budagov (Eds.), Economic and Social Trends for Sustainability of Modern Society (ICEST-II 2021), vol 116. European Proceedings of Social and Behavioural Sciences (pp. 28-38). European Publisher. https://doi.org/10.15405/epsbs.2021.09.02.4