GIS-Monitoring of Regional Transport Network
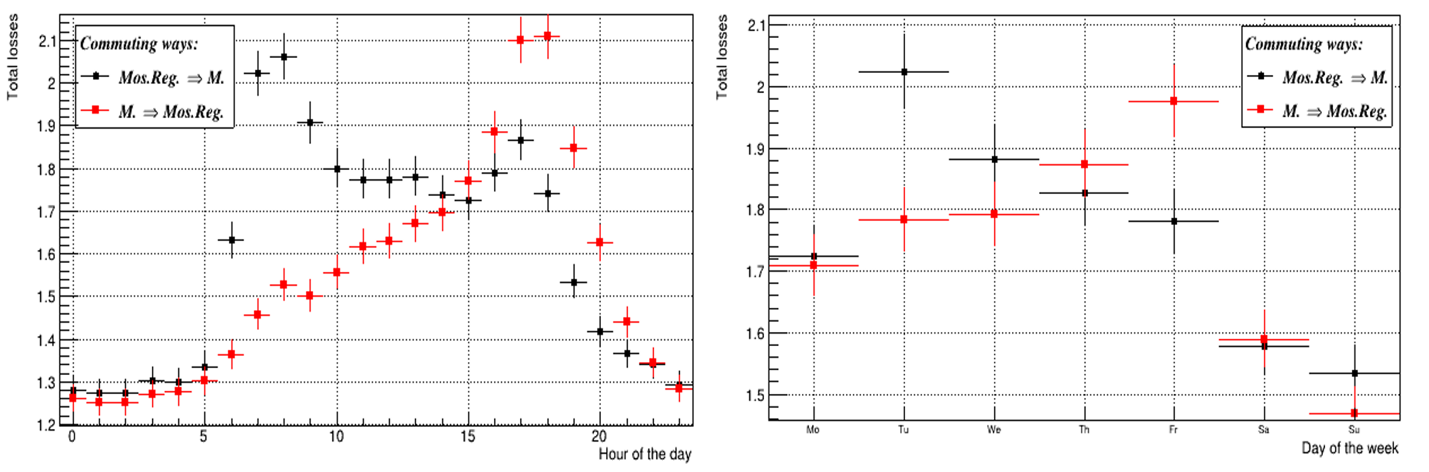
Figure 5: Time losses by commuters depending on the hour of travel in January 2020 (left) and the day of the week in September 4-10, 2017 (right). Black and red dots - centre-area and centre-area roots respectively. Along the vertical axis, the ratio of losses compared to a trip without traffic jams, calculated using formula (1b)
![Time losses by commuters depending on the hour of travel in January 2020 (left) and the day of the week in September 4-10, 2017 (right). Black and red dots - centre-area and centre-area roots respectively. Along the vertical axis, the ratio of losses compared to a trip without traffic jams, calculated using formula (1b)](https://www.europeanproceedings.com/files/data/article/10060/13425/CDSES2020F096.fig.005.jpg)