Sectoral Sustainability In Oil And Gas Production: Comparative Analysis Of Russian Regions
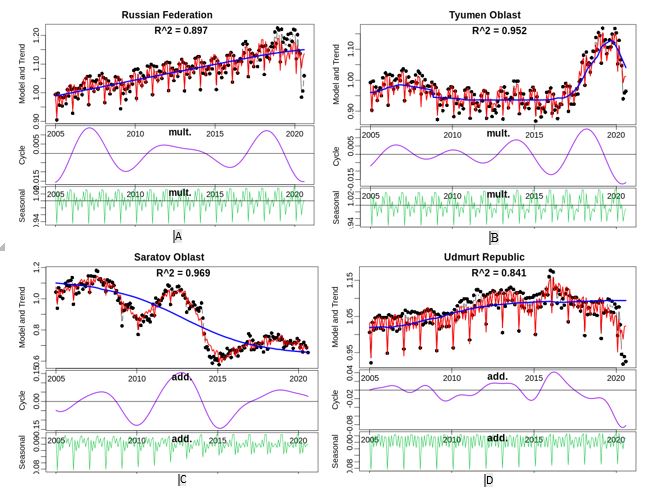
Figure 1: Graphs of oil and gas production cycles in selected Russian regions. Source: authors based on UISIS data (UISIS, 2020). Note: The figure was compiled in the author's program in R.