Modern Bayesian Leadership Analytics In High-Performance Business And Sport
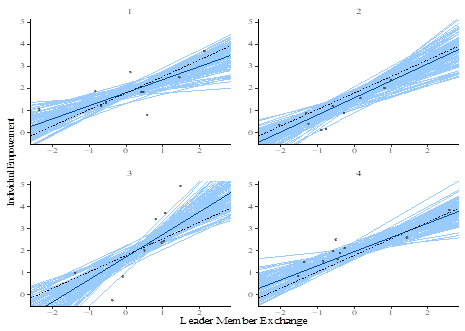
Figure 3: Graphical illustration of the team-specific results: observed data (dots), posterior mean regression lines for hierarchical (dark lines) and single-level (dark dotted line) models, and uncertainty (light lines)
![Graphical illustration of the team-specific results: observed data (dots), posterior mean regression lines for hierarchical (dark lines) and single-level (dark dotted line) models, and uncertainty (light lines)](https://www.europeanproceedings.com/files/data/article/10056/13028/ICLTIBM2019F014.fig.003.jpg)