Psychological Security In The Cities Of The Sverdlovsk Region
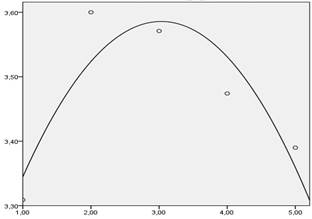
Figure 3: The graph demonstrating the link between the person’s satisfaction with the need for predictability and the population of the given territorial unit (Axis X – the size of the city where: 1 – small towns; 2 – middle-size towns; 3 – big towns; 4 – large cities; 5 – a city with the population over 1 million people. Axis Y – an indicator of satisfaction with the need for stability)
![The graph demonstrating the link between the person’s satisfaction with the need for predictability and the population of the given territorial unit (Axis X – the size of the city where: 1 – small towns; 2 – middle-size towns; 3 – big towns; 4 – large cities; 5 – a city with the population over 1 million people. Axis Y – an indicator of satisfaction with the need for stability)](https://www.europeanproceedings.com/files/data/article/10042/12301/PSYRGGU2020F019.fig.003.jpg)