Adaptive Forecasting Model Of The Number Of Marriages In Samara Region
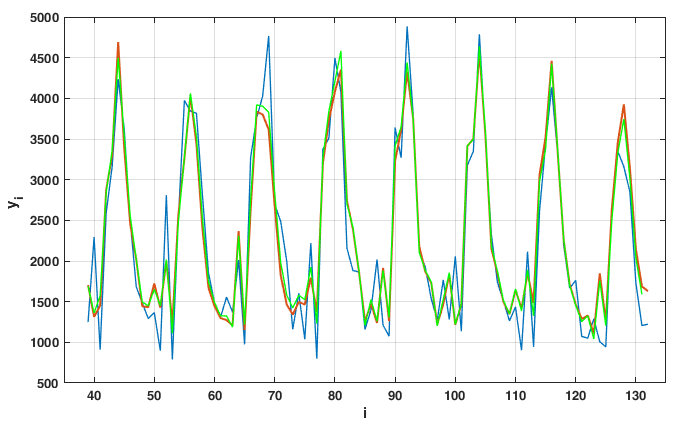
Figure 2: The number of marriages by month for 2006-2016 (blue line). Forecast with LS model (5) (red line). Forecast with RLS model (5) (green line). (The figure create in Matlab).
![The number of marriages by month for 2006-2016 (blue line). Forecast with LS model (5) (red line). Forecast with RLS model (5) (green line). (The figure create in Matlab).](https://www.europeanproceedings.com/files/data/article/1030/10224/GSPMED2019F180.fig.002.jpg)