Auditory-Visual Perception Analysis Of Multimodal Content Associated With Aggressive Behavior
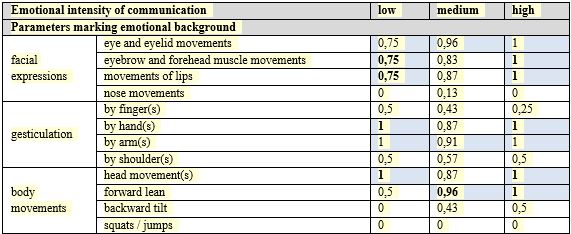
Figure 1: Distribution of the evaluations given by the recipients during the perceptual-visual analysis of situation 1 ( Hereinafter in the tables, the dominant values are marked with blue-gray filling. In the process of perceptual-visual analysis, the recipients had the right to indicate several features, i.e. the sum of evaluations in each table cell can exceed one (100%). First of all, we are interested in differences in perception, which characterize different degrees of emotional intensity of communication (the values in the tables are in bold font).)
< Back to article

