
How Do Students Involved In Pbl Perceive Wellbeing (The Perma Model)


Abstract
This article depicts the first stage of the research design of a doctoral thesis examining the possibility that a pedagogic approach using initiative-driven Project-Based Learning within the formal curriculum, promotes wellbeing according to the EPOCH model of adolescent wellbeing and stages in the process of achieving well-being, as suggested by Seligman's PERMA outline. EPOCH addresses five positive traits (Engagement, Perseverance, Optimism, Connectedness, and Happiness) that may result in well-being, positive life aspects such as physical health and more in adulthood. This article presents the findings of questionnaires distributed to 170 students at the beginning of the school year. These questionnaires constitute the first quantitative data collection stage of this research. As will be presented in detail in this article, the trend of the mean variable scores is rather high on the scale (e.g. Variable C mean score = 4.38). The general trend of Positive Thinking in the first measurement (the beginning of the school year) in four student cohorts shows a decrease in Positive Thinking with the increase in cohort.
Keywords: Project-Based LearningPositive psychological functioningWell-beingPERMA modelThe EPOCH measure of adolescent wellbeing
Introduction
Project-based learning (PBL) is an approach to teaching that enables students to be active in solving problems using the knowledge they possess. This approach differs from the traditional approach in which teaching is organized around topics and subjects in a specific area, with the teacher as the source of knowledge at the centre of the learning process. A PBL learning environment, emphasizes initiative as the heart of a learning process addressing solving real-world problems, with the aim of implementing the initiative – just as in real life. Initiative-based (or project-based) learning is not an activity intended to complement traditional learning but, rather, a comprehensive educational approach that stands on its own and provides a curricular foundation.
Positive education links traditional education and an exploration of happiness and well-being, as defined in Seligman's (2011) PERMA model and Values in Action (VIA) classification. Seligman (2011) has made efforts to integrate positive psychology into education to nurture well-being and happiness and minimize depression in younger people.
Traditional education together with an emphasis on well-being and happiness constitute what is currently known as Positive Education, which emphasizes of training both mind and heart, so as to nurture students' character as well as their academic capabilities and achievements.
Problem Statement
A preliminary survey of research in the field of positive education, within the context of the education system and schools, reveals that the research concentrates on the possibility of establishing training frameworks within the school that focus on developing a sense of capability and wellbeing. One is less likely to find studies or action plans that promote the development of these abilities in the context of a specific pedagogy.
Research Questions
At what extent a pedagogic approach using Project-Based Learning within the formal curriculum promotes:
Engagement
Perseverance
Optimism
Connectedness
Happiness
Purpose of the Study
Theoretical background
Main Characteristics of PBL
The questions that emerge from a broad survey of the relevant literature is: What are the unique and defining characteristics of project-based learning? In particular, what distinguishes it from action-based learning, investigative learning, or enquiry-based learning?
Moreover, a review of observations conducted in schools across the world reveals that many researchers have difficulty distinguishing between PBL, on the one hand, and learning that results in a product .
At the same time the past few decades have produced studies and efforts in the field aimed at distinguishing the unique characteristics of PBL and correlating them with far-reaching changes that have taken place in schools. These are reflected, for example, in various studies that were presented at the Autodesk Foundation Conference on Project-Based Learning (Autodesck Foundation, 1999).
At this conference teachers and researchers presented a range of projects and studies in the field, in the context of far-reaching changes that schools have seen when PDL is implemented.
Blumenfeld et al. (1991) argue that other alternative learning approaches have not received such widespread recognition because they do not adequately address the motivation and knowledge needed to cope with complex problems, nor do they take into account the unique perspective of the student in the learning process (Blumenfeld et al., 1991). Other researchers highlight PBL’s constructive characteristics and authenticity as well as its cultivation of new skills, which feature less in the other alternative learning approaches.
Drawing on a wide-ranging review of literature, Thomas (2000, pp. 4-5) proposes PBL five key criteria:
Centrality – The project forms the course of study, rather than resulting from it. The subject matter studied is the actual substance needed to implement the project (initiative). In other words, the project is the curriculum.
Driving question – The project is focused on a question or problem that inspires and requires the students to struggle with the main principles and concepts of the relevant discipline. The guiding question that drives a project can be one that connects various disciplines, but it is not only that. The driving question must promote learning in various disciplines and foster intellectual inquiry with a clear purpose.
Constructive investigations – The project requires constructive learning processes. In the course of learning students must construct the knowledge themselves. If the learning involves the recycling of available information rather than the actual construction of knowledge by the student, then it is not project-based learning.
Autonomy – The project is largely managed by the student. It cannot be planned and led exclusively by the teacher. PBL requires autonomy on the part of the student, as well as choice, self-education, independence in determining the place and time of study, and personal responsibility.
Realism – Projects are practical and realistic (executable), and they relate to real life. The project needs to be authentic in the context of the student’s world and life outside of school. This authenticity is manifested in the assignments carried out by the students, the end-products of the learning process, meetings with various experts in the course of implementing the project, and the presentation of outcomes, and of course in the project itself.
Project-based learning embodies real-world learning, with all its challenges. It is learning that derives from genuine need rather than simulation, learning that poses problems whose solutions are executable (Thomas, 2000, pp. 4-5).
Positive Psychology
Positive psychology is an approach addressing positive emotions and other things that contribute to the feeling of enjoying life (Seligman, 2011). According to Seligman, Positive Psychology findings
Positive psychology research findings and emphases do not seek to replace findings of human weaknesses and suffering are but rather to reach a balanced understanding of the human experience – the highlights, the low points, and everything that comes in between the two extremes.
In their book, Character Strengths and Virtues: A Handbook and Classification, Peterson and Seligman (2004) identified a set of twenty-four-character strengths that were classified into six broad categories of virtue, or attributes of a healthy, high-functioning mind.
Over the past twenty years, many books and articles have been written on positive psychology. Some seek to explain the approach; some seek specific criteria for research in the field, and some attempt to provide formulas and solutions for achieving happiness.
In light of these advances in the field of positive psychology and studies that clearly demonstrate the acquired ability of positive thinking, the education system has started to explore this field.
Positive education links traditional education and an exploration of happiness and well-being, as defined in Seligman's (2011) PERMA model
The PERMA model:
P – Positive Emotions: Experiencing positive feelings such as joy, gratitude, interest, hope.
E – Engagement: Being completely immersed in activities that are challenging and require skills.
R – Relationships: Having positive relationships.
M – Meaning: Belonging to and serving something bigger than self and believing in it.
A – Accomplishment: Aspiring for success, mastery and high achievements.
Clonan et al. (2004) found that employing positive psychology in learning environments was a preventative aspect that enhanced individual strengths helped develop positive approaches and led to students' success and higher achievements. It was also proven to have a lasting influence on students' behaviour and tendency to change.
Research Methods
The EPOCH measure of adolescent wellbeing is a 20 items measure that was developed in order to find out the progress of adolescent towards wellbeing as was defined by Prof Seligman PERMA model (Seligman, 2011).
Findings
Quantitative Research Findings
This article presents a comparison of four student cohorts (8th, 9th,10th, 11th) at the beginning of the school year in their answers to the "Positive Thinking" questionnaire. The transition from a cohort to a higher one is described as an "increase in cohort," which in principle means an increase in the students' age. The "positive thinking" questionnaire consists of five variable or dimensions. Each variable/dimension is represented by 4 items.
Engagement
Table
Table
In order to facilitate the identification of the general trend, the following figure presents trend lines for the means of the various items according to cohorts (Figure
The general trend in items E2, (I get completely absorbed in what I am doing), E3 (I get so involved in activities that I forget about everything else) and E4 (When I am learning something new, I lose track of how much time has passed) is that the mean score decreases with the increase in the student age level.
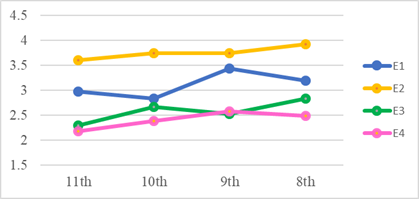
The general conclusion about the Engagement variable is that there is a certain tendency to decrease the mean value with the increase in cohort. This tendency is usually not statistically significant except for item E1 (When I do an activity, I enjoy it so much that I lose track of time), in which it was found that the mean in the 10th grade cohort was significantly lower than the mean in the 9th grade cohort.
This conclusion means that the comparison between classes does not support the possibility of an increase in Engagement with the increase in cohort at school, but there is also no significant decrease either.
Perseverance
In order to facilitate the identification of the general trend, the following figure presents trend lines for the means of the various items according to cohorts (Figure
The figure shows that in all cohorts, item P1 (I finish whatever I begin) has the lowest mean score. Item P4 (I am a hard worker) has the highest score in the first three cohorts. Regarding items P1, P3, and P4, the high students' cohort is the one with the lowest mean score.
The general trend in items P1, (I finish whatever I begin), P3 (Once I make a plan to get something done, I stick to it) and P4 (I am a hard worker) is that the mean score decreases with the increase in the student age level.
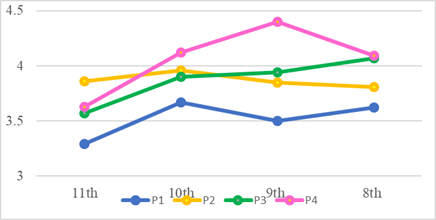
The conclusion is that the comparison between classes does not support the possibility of an increase in Perseverance with the increase in cohort at school.
Optimism
This dimension was measured by four items. For each item, students marked the extent to which the item described them on a 5-point Likert scale (from 1 = never to 5 = always).
In order to facilitate the identification of the general trend, the following figure presents trend lines for the means of the various items according to cohorts (Figure
The figure shows that in all cohorts, item O3 (I think good things are going to happen to me) has the lowest mean score. The general trend is a decrease with the increase in the students' cohort.
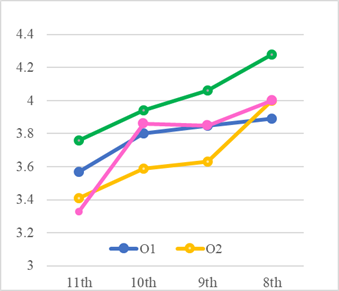
The general conclusion about the Optimism variable is this variable's mean score decreases with the increase in students' cohorts. This finding applies to both the general Optimism variable and each of the items comprising it.
This conclusion means that the comparison between classes does not support the possibility of an increase in Optimism with the increase in cohort at school.
Connectedness
This dimension was measured by four items. For each item, students marked the extent to which the item described them on a 5-point Likert scale (from 1 = never to 5 = always).
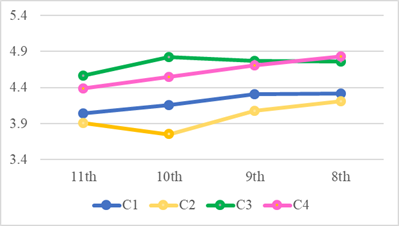
The general conclusion about the Happiness variable is this variable's mean score decreases with the increase in the students' cohort. This finding pertains to the general Happiness variable and each of the items comprising it.
This conclusion means that the comparison between classes does not support the possibility of an increase in Happiness with the increase in cohort at school.
Conclusion
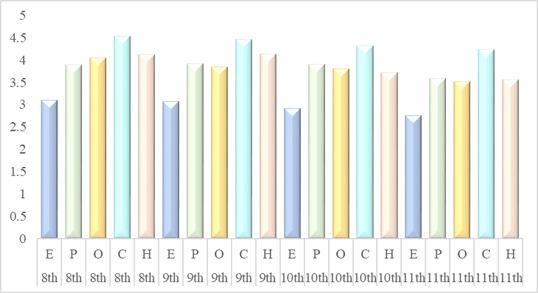
It can be seen that the trend of the mean variable scores is rather high on the scale (e.g. Variable C mean score = 4.38). The mean in the upper range of the scale. The only variable whose mean score is relatively low is E, with a mean score = 2.96.
In summary of the quantitative findings emerging from the comparison between the student cohorts at the first measurement date, i.e. at the beginning of the school year, means of all variables in the different cohorts are presented in Figure
Spearman correlation coefficient was calculated for each of the general variables, describing the linear relationship between the ordinal independent variable, cohort, and the general dependent variable. The correlation values are presented in Table
Table
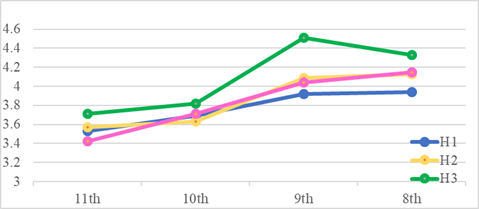
The general Positive Thinking variable that includes all 20 items (the reliability of the Alpha Cronbach measurement of these 20 items was 0.893). The Spearman correlation coefficient between the Positive Thinking variable and the student cohort is rs=0.28 (SIG = 0.0001). Furthermore, the separate conclusion of the variable Positive Thinking, the general variable Positive Thinking also shows a trend of decrease as the age increases (Figure
There are some interesting findings according to the following variables: connectedness, perseverance and happiness. It is interesting to understand the fact that the variable of connectedness is the highest at all the age cohorts. In addition, the variable of perseverance is also high at all cohorts. However, the variable of happiness is the most interesting one, it's increases from 8 to 9 grade and decrease sharply at the 10 grades.
In general, we cannot ignore the fact that the main general Positive Thinking trend in the first measurement in four student cohorts is a decrease in Positive Thinking with the increase cohort. This is reflected in the various items in the questionnaire that represent the five Positive thinking dimensions, the general variables of the different dimensions, and the Positive Thinking variable.
The students answered the questioner at the beginning of the year not too long after the end of the summer vacation. The most important thing for them was that they meet again their friends and they do have good connections. In addition, even though It is more difficult for them to start studying again, it's important to say that at the 10 grade the students encounter for the first time studying for the matriculation tests that will take place at the end of the year. Since, the pedagogic way of teaching is a much more conservative and all most all ways not PBL, the fact that even at the 8th and 9th grade we cannot see an increase in cohorts can be explained by the fact that the students are used to learn in PBL and there is a growing demand for academic achievements.
In the future, during the last week of the academic year the same student will answer the same questions. It will be interesting to see then what happens and to compare between their answers at the beginning of the year and its end.
References
- Autodesk Foundation. (1999). Kids who know and do. Program for the 7th Annual Conference on Project-Based Learning, San Francisco. San Rafael, CA: Autodesk Foundation.
- Blumenfeld, P. &, Soloway, E. & Marx, R., Krajcik, & J., Guzdial, M. & Palincsar, A. (1991). Motivating project-based learning: sustaining the doing, supporting the learning. Educational Psychologist, 26, 369-398.
- Clonan S. M., Chafouleas S.M., McDougal J.L., Riley-Tillman T.C. (2004) Positive psychology goes to school: are we there yet? Psychology in the schools, 41(1), 101-110.
- Kern, M.L., (2015). The EPOCH Measure of Adolescent Well-Being. Melbourne Graduate School of Education, Melbourne: Melbourne University Publishing.
- Seligman M.E.P. (2011) Flourish: A Visionary New Understanding of Happiness and Well-being. New York: Simon and Schuster.
- Peterson, C. Seligman, M. E. P. (2004). Character strengths and virtues: A handbook and classification. New York: Oxford University Press and Washington, DC: American Psychological Association.
- Thomas, J.W. (2000). A review of project-based learning. San Rafael, CA: The Autodesk Foundation.
Copyright information

This work is licensed under a Creative Commons Attribution-NonCommercial-NoDerivatives 4.0 International License.
About this article
Publication Date
25 June 2019
Article Doi
eBook ISBN
978-1-80296-062-4
Publisher
Future Academy
Volume
63
Print ISBN (optional)
-
Edition Number
1st Edition
Pages
1-613
Subjects
Teacher, teacher training, teaching skills, teaching techniques, special education, children with special needs
Cite this article as:
Yedidia, T., & Roman, A. (2019). How Do Students Involved In Pbl Perceive Wellbeing (The Perma Model). In V. Chis, & I. Albulescu (Eds.), Education, Reflection, Development – ERD 2018, vol 63. European Proceedings of Social and Behavioural Sciences (pp. 266-275). Future Academy. https://doi.org/10.15405/epsbs.2019.06.34