Diagnostics Of The Production Potential Of The Regions Of Russia
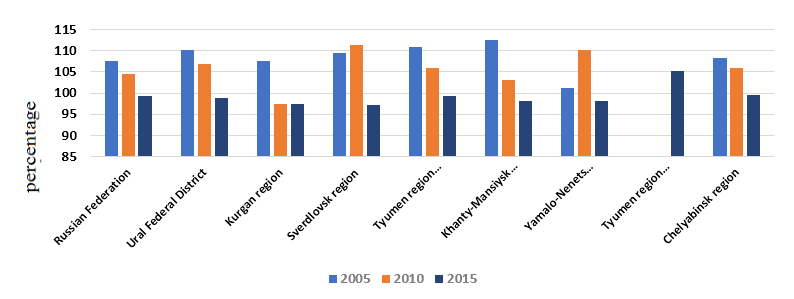
Figure 2: Dynamics of change in the index of the physical volume of GRP by subjects of the UFD (in constant prices; in % to the previous year). Source: Federal state statistics service (2017)
![Dynamics of change in the index of the physical volume of GRP by subjects of the UFD (in constant prices; in % to the previous year). Source: Federal state statistics service (2017)](https://www.europeanproceedings.com/files/data/article/99/5130/CIEDR2018F13.fig.002.jpg)