Diagnostics Of The Production Potential Of The Regions Of Russia
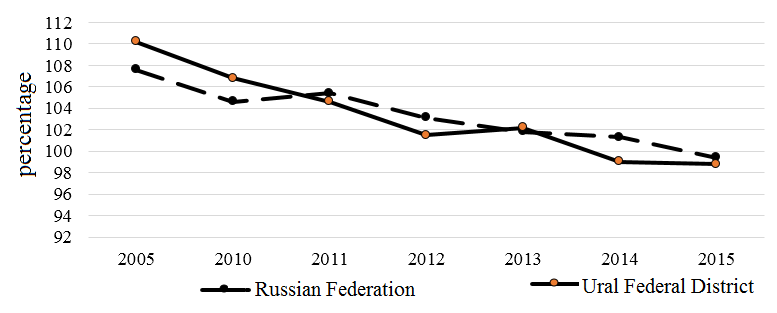
Figure 1: Dynamics of change in the index of the physical volume of GRP in the Russian Federation and the Ural Federal District (in constant prices; as a percentage of the previous year) 2005–2015. Source: Federal state statistics service (2017)
![Dynamics of change in the index of the physical volume of GRP in the Russian Federation and the Ural Federal District (in constant prices; as a percentage of the previous year) 2005–2015. Source: Federal state statistics service (2017)](https://www.europeanproceedings.com/files/data/article/99/5130/CIEDR2018F13.fig.001.jpg)