Management In Academic Teaching Staff Activity: Modeling Of Rating System Indicators
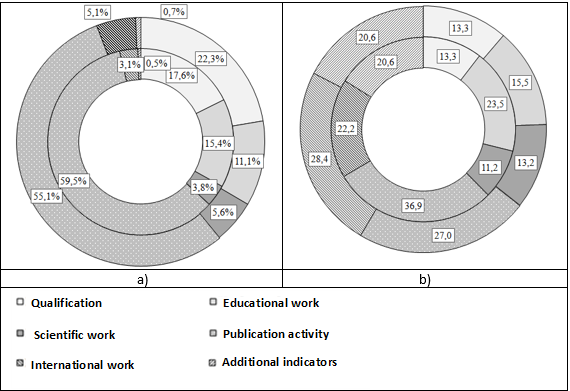
Figure 3: Structure of the group assessment: а – score distribution along the groups; b – the ration of the average score in a group and in groups. The external ring corresponds to the data of 2015, the internal ring corresponds to the data of 2016