Internal And External Components Of The Socio-Economic Regional Development
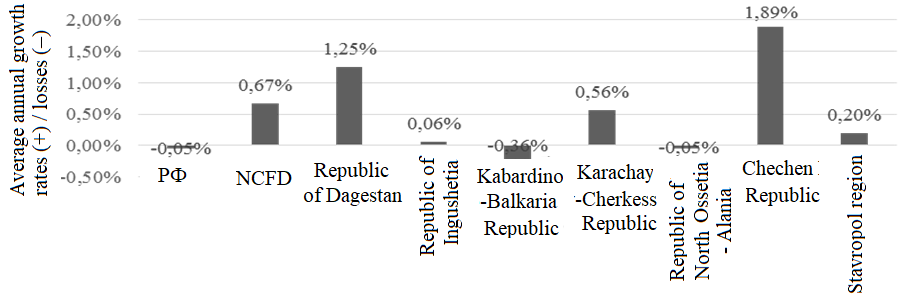
Figure 2: Average annual growth rates (+) / losses (–) of the number of people employed in the economy in the regions of the NCFD and in the Russian Federation in 2006–2016, %
![Average annual growth rates (+) / losses (–) of the number of people employed in the economy in the regions of the NCFD and in the Russian Federation in 2006–2016, %](https://www.europeanproceedings.com/files/data/article/104/5015/SCTCMG2018FA222.fig.002.jpg)