
Analysis Of Spatial Distribution Of Human Development Index In Republic Of Bashkortostan

Abstract
The goal of this study is to carry out a complex analysis and identify spatial dependencies in the human capital distribution in the Republic of Bashkortostan. The indicator to measure human capital is the Human Development Index calculated for each of municipalities of the Republic of Bashkortostan in dynamics from 2007 to 2013. For performing a complex study of spatial dependencies in the distribution of the HDI, the author proposes a five-stage technique. The first stage of the study resulted in forming a weighted spatial matrix of inverse distances between municipalities' administrative centers. During the second stage that involved calculating global and local indices of spatial autocorrelation, the hypothesis of the presence of spatial dependencies in HDI distribution was confirmed. The third stage allowed visually analyzing the spatial intercorrelation of the HDI for particular municipalities based on scatter plots. The fourth stage consisted of the maximum likelihood estimation of the spatial autoregression and spatial error models provided the opportunity for a quantitative estimation of the identified intercorrelation in the spatial distribution of the HDI in municipalities. The concluding part was devoted to interpreting obtained results of spatial regression modeling. Research results showed that the distribution of the Human Development Index in the Republic of Bashkortostan is characterized by stable positive spatial autocorrelation. The dynamics display a strengthening of spatial dependencies in the HDI distribution in the Republic of Bashkortostan, explained by the increasing role of urbanization and convergence of human resources to relatively big cities.
Keywords: Human potentialspatial correlationBashkortostan
Introduction
The issue of modeling the economic development of countries and regions (on macro- and meso-levels) with consideration of the dynamics of human capital is known for a long time and is reduced to studying the trend towards economic convergence or divergence of territories. This issue can be resolved using different methodological approaches used with different target indicators (as a rule, gross regional product per capita): input-output models including those with integrated econometric models, estimated general equilibrium models. Recently, analysis using econometric models that factor in spatial effects has become more and more popular.
A separate issue is the problem of correct assessment of human capital on the micro- and meso-levels (districts and regions of countries). Due to the unavailability of complete data for making estimations on UN's micro- and meso-levels, researchers frequently have to resort to modifications of this technique depending on the country that it is applied to (Anichin & Timofeev, 2013; Shamsutdinova, 2018). For example, one study (Anichin & Timofeev, 2013) describes a further evolution of this technique based on rejecting change transformations (taking logarithms) and provides an estimation of this index for ten regions of Russia using the data of 2009. The overall index of human capital development based on an extended list of indicators (over 30) allowed the authors to carry out clustering and build a ranking of Russian regions (Mazelis & Lavrenyuk, 2017). The overall index was represented by the weighted average of normalized factors.
At the moment, there exists a large amount of research devoted to assessing human capital at various hierarchical administrative levels (country, region, municipality). However, most studies are confined to adjusting the technique for human capital assessment and are, in general, descriptive in terms of territory development.
When using a systems approach to study human potential, it is also necessary to take into account its spatial distribution across the territory of interest, which allows to ensure a comprehensive research of the issue.
Problem Statement
The dynamics of indices of the development of human potential are generally analyzed using descriptive statistical characteristics (Kravchenko & Sharkevich, 2011). The proposed classification of human potential by types of development allowed to identify regional peculiarities. Research has shown that with the virtually unchanging national value of the HDI in Russia, its structure undergoes significant changes: the increase in the life expectancy index in practically all regions of Russia is accompanied by an increase in the income index with some negative dynamics in the knowledge index.
A study by (Shamsutdinov at al., 2018) is devoted to identifying the presence of spatial dependencies. Using the spatial correlation indices (local Moran's index, Getis's and Getis-Ord's indices), the authors have estimated the "spatial gradient" of change of the index of development of human potential in the regions of Russia (Getis & Aldstadt, 2004). The analysis showed a trend toward differentiation of regions by human capital level as a result of the "catching-up" type of the Russian economy, which is accompanied by the emergence of leading regions with high levels of human capital, matching the "center-periphery" concept.
Spatial econometric models are efficiently used to simulate economic and innovative development in many countries (Mendoza-González, Valdivia-López, & Quintana-Romero, 2016; Zhang, Liu, Wang, & Li, 2017; Li, & Miao, 2017). By selecting Mexico City as a large center in Mexico and the remaining territory as periphery, an econometric simulation was carried out with consideration for human capital, internal migration, share of the "creative class" and small enterprise, as well as spatial autocorrelation at the micro-level. Spatial panel models with fixed effects (such as SEM and SLM) (Zhang, Liu, Wang, Li, & 2017), were used to study the differences in the degree of regional economic development of China's twelve western provinces. It was successfully confirmed for these regions that the GRP is positively correlated with the amount of capital, government spending, direct foreign investments, human capital, and the number of patent applications.
Besides, spatial models allow to consider the differentiation in the distribution of human capital. Researchers (Li, & Miao, 2017) used them to study the disproportion of the regional economic development of the provinces of China in the Yangtze area along with the influence of the disproportion on internal migration. While the eastern zone of this territory is characterized by the megapolis pattern and the "center-periphery" relations, local centers were identified in the central and western zones. Due to migration movements, the economic development of the donor and the recipient territories was divergent in the period from 2000 to 2010. It is claimed that migration is the main factor of the spatial economic inequality of the territories, followed by the level of industrialization, human capital, and tax policies.
The regional economy of Romania (gross regional product) was analyzed by (Goschin, 2017) both using the conventional multi-factor regression model and models that include spatial correlations. The independent variables were chosen to be the total trade volume, R&D investments, labor productivity, quantity of enterprises, volume of foreign investments, and human capital (amount of higher education graduates). Spatial autoregressive models (SAR) and spatial error models (SEM) were chosen as tools. It is highlighted that the difference in the economic development rates of different territories results in migration of human capital to the capital and other large centers, which facilitates the polarization of the country's economy. Because of this, absolute and relative beta divergence (the inability of the economically weaker regions to "catch up" with the more developed ones) is observed in Romania's economy in the short term, while the long term shows sigma divergence (the increase of the spread among the regions).
Spatial econometric analysis tools are used to simulate the indicators that are included in the estimation of human potential, first of all, the human capital (Kalapouti, Petridis, Malesios, & Dey, 2017; Jaya, Toharudin, & Abdullah, 2018; Ripamonti, & Barberis, 2017). The goal of the study by (Kalapouti, Petridis, Malesios, & Dey, 2017) was studying the influence of the share of patent applications, development level, unemployment level, and the degree of technological diversification on the efficiency of innovations. The base of information was composed of the data for 192 European regions in the period from 1995 to 2006 and the methodological base was represented by a model of structural equations. Spatial modeling of the index of the secondary school education in the Indonesian province of Western Java (Jaya, Toharudin, & Abdullah, 2018) was carried out using a Bayesian spatial regression model (BSAR) and the k-nearest neighbors method was used to identify the structure of spatial connections. The standard of student knowledge assessment was among the significant independent variables. The data of the regions of Italy for 1997 and 2007 together with structural equation models with spatial dependencies (Ripamonti, & Barberis, 2017) were used to identify significant differences in descholarization (refusal to gain complete secondary education) in the provinces. It turned out that its level is particularly high in the south of the country. Spatial models have revealed the longitudinal effect of human capital on the share of descholarization, which is also a premise for the migration behavior of the working youth.
Spatial analysis of the human potential development index in the Republic of Bashkortostan was carried out by E.A. Gafarova (Gafarova, 2017). The author considers five different variants of constructing weighted matrices and their estimation using spatial coefficients of autocorrelation. All types of spatial matrix construction showed the presence of a positive spatial autocorrelation in the HDI distribution. At the same time, the largest value of the global Moran's coefficient corresponds to the weighted inverse distance matrix that will be used in this study.
This day, a complex analysis of the system of spatial relations of the mutual influence of human capital among the territorial entities in the Republic of Bashkortostan does not exist. Due to this, it is necessary to identify the presence of spatial autoregressive dependencies in the distribution of the HDI and determine their direction and quantitative parameters.
Research Questions
The central issues of this study are checking the hypothesis of the presence or absence of spatial autoregressive dependencies in the distribution of the HDI (Human Development Index) in the Republic of Bashkortostan and identifying the differences in the dynamics of spatial autoregressive dependency distribution in 2007 and 2013.
The hypotheses of spatial lag dependencies will be checked using an inverse distance spatial weight matrix based on the information about the mileage of the motorways between municipality centers.
The logic of the research will be constructed along the following scheme:
The described research logic allows to implement a complex approach to studying the issue of spatial distribution of human capital in the Republic of Bashkortostan.
Purpose of the Study
The goal of this study is to carry out a complex analysis and identify spatial dependencies in the distribution of human capital in the Republic of Bashkortostan.
Research Methods
The components of the Human Development Index are health, and the levels of education and income in the following indicators: life expectancy at birth, total education level index (proportion of the illiterate population with the factor of 2/3 and the proportion of students in the corresponding age group with the factor of 1/3); living standards measured by real GDP per capita (from 100 to 40,000 dollars per purchasing power parity). Due to the fact that not all statistical data necessary to calculate the HDI are collected at the level of regions of the Russian Federation, a simplified technique of estimating the index was used (HDRF, 2015). For the regions of Russia, the HDI was estimated as the arithmetical mean of the three components mentioned above.
I was the first time taht the Human Development Index at the municipality level was calculated according to the following simplified method:
- life expectancy at birth indicator for each municipality for the desired year was calculated as a three-year average (2007 for 2006-2008; 2013 for 2012-2014);
- income indicators in the total index are the indicators of average monthly salary and average monthly pension, also averaged per three years;
- education index is determined based on the values of the average training duration and literacy of the population according to census data.
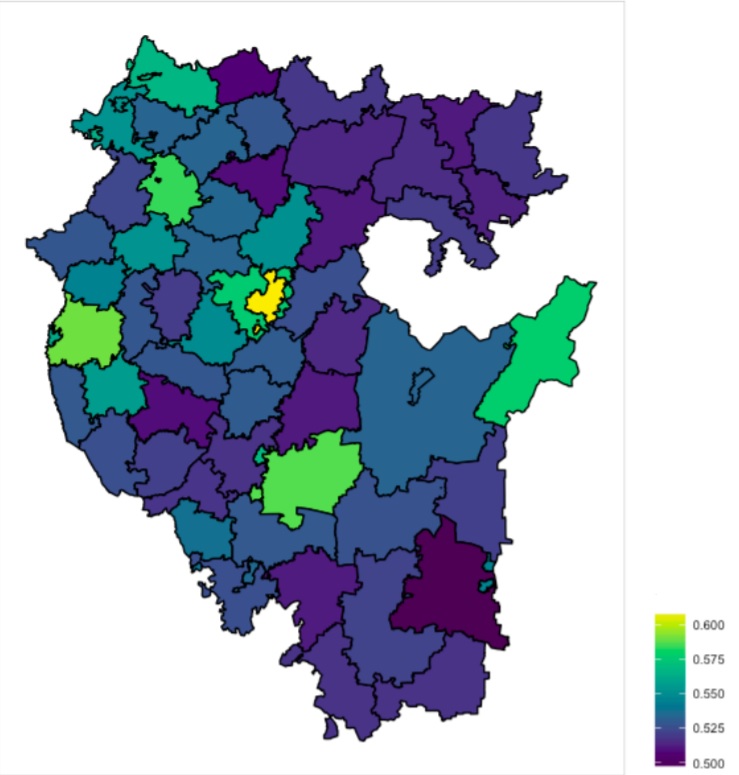
A diagram of index intensity was drawn to visualize the distribution of the HDI in the municipalities of the Republic of Bashkortostan as of 2007 (Fig. 1).
The function of the weighted matrix
The presence of clustering of municipalities with respect to the distribution in the HDI value was identified using the global Moran's index determined according to the following formula (Introduction to Spatial Analysis, 2006):
where
The global Moran's index assumes values in the interval [0; 1] while its expected value (with null hypothesis : absenceof a discernable autocorrelation dependency) is determined through the formula:
Values below
indicate a negative spatial autocorrelation, larger values indicate a positive one. When
=
, observation values in the neighboring territories are distributed randomly (Lesage, Pace, 2009). Statistical significance of Moran's index is checked based on the standard
Unlike Moran's index, the Gini index is measured from 0 to 2 and determined through the formula:
where
is the number of municipalities indexed
and
,
is the HDI value in
It is considered that if the Gini index value is in the range from 0 to 1, positive autocorrelation is observed, while values from 1 to 2 display negative autocorrelation.
At the second stage of the research after establishing the relevance of measuring spatial autocorrelation relations using Moran's and Gini indices, actual spatial regression modeling is carried out. A broad variety of regression equations with various specifications is used to factor in the spatial influence, but this study employed the following models in their general view:
1) spatial lag models (SAR):
where are the elements of the weighted spatial matrix, ρ is the spatial autoregression coefficient determining the "average" degree of similarity between and the "neighbors".
2) spatial error model (SEM) recorded in the matrix form looks as follows:
where
is the matrix of HDI values in municipalities,
The entire analysis of the spatial distribution of the HDI in the Republic of Bashkortostan was carried out using R.
Findings
As the result of the calculations performed in R, the value of Moran's global index of spatial autocorrelation for 2007 was 0.226 with the
This way, the preliminary analysis of the global spatial correlation coefficients confirmed the presence of spatial autocorrelation dependencies in the distribution of the HDI in the Republic of Bashkortostan. The estimated values of the Gini coefficients (2007:
,
The graphs of the human potential development scatter plots presented in Fig.
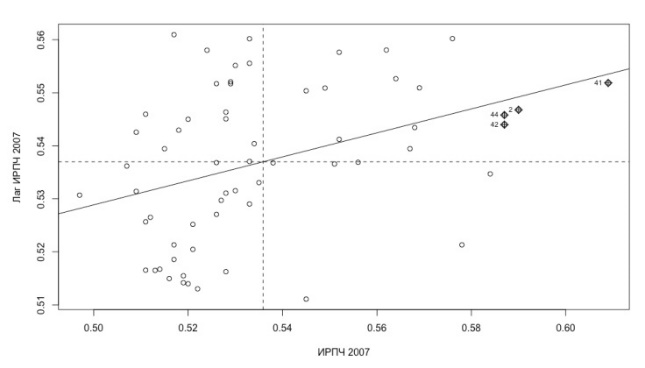
![Scatter plot of the HDI in the municipalities of the Republic of Bashkortostan (2013)] The results of analyzing the index and the scatter plots allow to make a conclusion about the presence of positive spatial autocorrelation for 2007 and 2013. It is important to note that the municipalities adjacent to Ufa (the highest HDI value) also tend to have high HDI values.](https://www.europeanproceedings.com/files/data/article/104/4939/SCTCMG2018FA146.fig.003.jpg)
The concluding stage of the research included building spatial lag models with SAR and SEM specifications (for 2007 and 2013) that were assessed using the maximum likelihood method. The results are shown in Table 2, 3 and Table 4, 5 respectively.
In all spatial autoregression and spatial error models, the coefficients were considered statistically different from zero at the level of significance
The statistical dependence of the constant term in each of the models (Table
Conclusion
The following conclusions were made according to the results of the study.
1) The distribution of the Human Development Index in the municipalities of the Republic of Bashkortostan is characterized by stable positive spatial autocorrelation. The city of Ufa plays a significant role in the distribution of human potential in adjacent municipalities.
2) The dynamics display a strengthening of spatial dependencies in the distribution of the HDI in the Republic of Bashkortostan, explained by the increasing role of urbanization and convergence of human resources to relatively big cities.
3) Competition for the resources that facilitate the increase of the HDI is observed in a number of municipalities. A number of municipalities form a cluster of territories with low level of human potential development. Mostly, these are territories in the northeast of the Republic.
4) The obtained models of spatial autoregression and spatial error allowed not only to confirm the hypothesis of the presence of spatial dependencies but also qualitatively assess it.
5) It is planned to continue further research in the direction of extending the spatial models with exogenous influence factors that explain the change in the spatial distribution of the HDI.
The scientific novelty of the approach proposed by the authors is the possibility to identify spatial autocorrelation dependencies in the distribution of the HDI among municipalities, which can serve as a foundation for the strategic development planning of the region as a whole.
Acknowledgments
This research was carried out with support from the RFBR (project No. 14-01-97014).
References
- Anichin, V.L., Timofeev, I.Iu., (2013). Using the UNDP methodology to assess the development of human potential of the regions of the RF. Science Bulleting. History Series. Political Science. Economics. Informatics, 1 (144), 15-20.
- Gafarova, E.A., (2017). Study of the spatial distribution of human capital in the regional system, Issues of functioning and development of territorial social and economic systems, 84-88.
- HDRF, (2015). Report on the human development in the Russian Federation in 2015, Moscow: Analytical Center for the Government of the Russian Federation.
- Kravchenko, E.N., Sharkevich, I.V. (2011). Specifics of the development of human potential in the regions of the present-day Russia. Economy of Region, 3, 71-79.
- Mazelis, L.S., Lavrenyuk, K.I. (2017). Quantitative model of assessing the regional human capital. Azimuth of scientific research: economics and management, 6, 4(21), 167-170.
- Getis, A., Aldstadt, J., (2004). Constructing the Spatial Weights Matrix Using a Local Statistic. Geographical Analysis, 36(2), 90-104. https://dx.doi.org/110.1111/j.1538-4632.2004.tb01127.x
- Goschin, Z., (2017). Exploring regional economic convergence inRomania. A spatial modeling approach. Eastern journal of European studies, 8, 2, 127-146.
- Jaya, I. G. N. M., Toharudin, T., Abdullah, A. S. (2018). A bayesian spatial autoregressive model with k-NN optimization for modeling the learning outcome of the junior high schools in West Java. Model Assisted Statistics and Applications, 13(3), 207-219. https://dx.doi.org/1
- Kalapouti, K., Petridis, K., Malesios, C., Dey, P. K. (2017). Measuring efficiency of innovation using combined Data Envelopment Analysis and Structural Equation Modeling: empirical study in EU regions. Annals of Operations Research. https://dx.doi.org/1
- Li, J., Miao, C., (2017). Impact of population flow on regional economic disparities in the Yangtze River economic belt. Acta Geographica Sinica, 72, (2), 197-212. https://dx.doi.org/1
- Mendoza-González, M., Valdivia-López, M., Quintana-Romero, L., (2016). Spatial Interaction Regional Model for the Mexican Economy (SIRMME): A Special Case for Mexico City Metropolitan Area. Journal of Reviews on Global Economics, 5, 84-100. https://dx.doi.org/1http://dx.doi.org/10.6000/1929-7092.2016.05.08 12
- Ripamonti, E., Barberis, S., (2017). The Effect of Cultural Capital on High School Dropout: An Investigation in the Italian Provinces. Social Indicators Research. https://dx.doi.org/1
- Shamsutdinova, N., (2018). Spatial Distribution of Human Development Index in the Regions of Russia. Journal of Advanced Research in Law and Economics, 8, 8, 2594-2604.
- Zhang, J., Liu, Q., Wang, C., Li H. (2017). Spatial–Temporal Modeling for Regional Economic Development: A quantitative Analysis with Panel Data from Western China. Sustainability, 9, 1955; https://dx.doi.org/1
Copyright information

This work is licensed under a Creative Commons Attribution-NonCommercial-NoDerivatives 4.0 International License.
About this article
Publication Date
29 March 2019
Article Doi
eBook ISBN
978-1-80296-057-0
Publisher
Future Academy
Volume
58
Print ISBN (optional)
-
Edition Number
1st Edition
Pages
1-2787
Subjects
Sociolinguistics, linguistics, semantics, discourse analysis, science, technology, society
Cite this article as:
Lakman, I., Gorshechnikova, A., Shamsutdinova, N., & Prudnikov, V. (2019). Analysis Of Spatial Distribution Of Human Development Index In Republic Of Bashkortostan. In D. K. Bataev (Ed.), Social and Cultural Transformations in the Context of Modern Globalism, vol 58. European Proceedings of Social and Behavioural Sciences (pp. 1262-1271). Future Academy. https://doi.org/10.15405/epsbs.2019.03.02.146