
Influence Of Sport On Laterality In Children Aged 9-11 Years

Abstract
In this study, we try to highlight the influence of practicing a sport on laterality in 3rd and 4th graders from the “Dante Alighieri” Theoretical High School in Bucharest. The two groups of children (one made up of subjects practicing sport and free-time motor activities, and the other not involved in extracurricular sports activities) were subjected to the following tests: Ruler Test, Touch the Plates, measurement of the response rate to visual and auditory stimuli. The sports practiced by children outside the physical education classes are: basketball, football, handball, athletics, water sports, gymnastics, karate, field tennis, climbing, sports dance and ballet. For each test, each subject had five attempts for both the right hand and the left hand; the mean of the five attempts on each side was recorded, and the differences between the left and right hand results were analysed and compared between children belonging to the two groups. We also tried to establish a correlation between the results of children in the group practicing sports and the sport practiced. Thus, our hypotheses are the following: in sports practicing children, we expect to find lower differences between the right and left hand test values (functional differences in the smaller cerebral hemispheres), and in the “Touch the Plates”, the left-right differences are expected to be smaller for martial arts, basketball and handball.
Keywords: Lateralitysport practicecoordination
Introduction
According to Schmidt (1991), the remarkable human capability to perform skills is a critical feature of our very existence. People are born with this capability of producing many skills that develop with maturation, for instance walking, running and balance; other abilities are developed, educated and improved over the course of their lives, being useful in ordinary everyday actions, in practicing various activities or professions and, where appropriate, in practicing sports, regardless of their level. But to get there, coordination in general and bilateral coordination in particular is an essential part of adapting and integrating the child into the environment. Good bilateral coordination is an indication that both brain hemispheres effectively communicate and exchange information. Children with ambilateral coordination disorders may have difficulties in accomplishing daily tasks such as dressing and tying shoelaces or in performing activities that involve fine motor skills (joining Lego blocks, cutting – paper stabilisation with one hand and holding the scissors with the other one) or activities such as walking, crawling, climbing stairs, roller skating or cycling. Thus, given that day-to-day activities are mostly bimanual movements, the understanding of bilateral coordination is important at all ages, moreover, functional problems are correlated in some cases to other various disorders (Vasconcelos, Rodrigues, Barreiros, & Jacobsohn, 2014; Woytowicz, Whitall, & Westlake, 2016; Ostwald, Snowdon, Rysavy, Keenan, & Kane, 1989). By the age of 3-4 years, children can use both hands equally, working with the hand closest to the subject of interest. After this age, children should develop their ability to cross the midline (Child’s Play Therapy Center, 2014), namely to cross over the midline of the body with a segment while fulfilling a motor task (e.g. crossing the legs, touching the opposite elbow etc.). Establishing the dominant hand after this age is an indicator of maturation of the brain and is correlated with the emergence of the ability to cross the midline. A well-defined body pattern occurs only in well-coordinated children (Stănescu, 2002), and in its absence, in the cognitive plane, writing and reading deficiencies may occur. The delay in specifying laterality causes children problems with spatial orientation, materialised by the inability to distinguish left and right, difficulties in organizing text writing on the page, confusing letters and figures, such as d and b, p and q, n and u, 6 and 9 etc. (Stănescu, 2002, p. 87). To answer why lateralisation occurs, given that in other creatures it has not been identified, there have been many assumptions about our hominid ancestors (Goldman, 2014) who mostly used right-hand tools (Homo habilis, Homo erectus, now 1.5 million years). The anthropologists’ argument is that the right-handedness rule for humans is due to language, which is controlled by the left hemisphere of the brain.
Although the left hemisphere is specialised in language, the preference for the right hand has simply intensified as an effect of intensifying the activity of this hemisphere. Thus, it was hypothesised that lateralisation was induced by the bipedal stance, and the preference for the right hand appeared later, as a result of the evolution of language. However, this hypothesis is hard to prove, as it would involve neurological tests on the ancestors of humans (Goldman, 2014). At least 75% of the human population in all cultures prefers to use the right hand to perform most of the motor tasks at different levels of dexterity.
Problem Statement
After specifying that laterality is a sign of balanced brain development in 3-4 years old children and especially a sign of an effective brain hemisphere communication, for younger pupils, particularly those who have already chosen to practice a sport, there is a need to drive this communication between brain hemispheres, in the sense of transferring dexterity to the non-dominant part in order to obtain the best performance. Thus, in physical education and sports classes, mainly at primary school level, the proposed activities are based on the development of psychomotor skills (Sopa & Pomohaci, 2015a; Sopa & Pomohaci, 2015c). In addition, sport practicing has a positive influence on the dexterity of the non-dominant limb, all the more so as the training is conducted in this respect and, on the other hand, if the sport involves the use of both limbs equally.
Research Questions
There are two aspects that we expect to capture and illustrate through this research, namely that the response time to visual and auditory stimuli is different for the right hand and left hand and that the speed of execution/repetition of a simple movement is also different, but differences are smaller in the case of the group of children practicing sports. Also, differences between the left and right hand executions are expected to be lower for children practicing ball sports than those practicing swimming or athletics.
Purpose of the Study
Testing and evaluating the physical fitness of young generations has become important, scientists stating that the monitoring of physical activity can reduce sedentariness, health problems, social exclusion and stress (Sopa & Pomohaci, 2015b). Starting from the premise that laterality is a component of the coordination abilities, whose manifestation can be measured, evaluated and educated, we have tried to highlight functional differences in the brain hemispheres, in terms of differences in the response time to visual and hearing stimuli measured for the right and left hands, as well as by measuring the speed of execution (repetition) of a simple movement performed with both the right hand and the left hand. In this regard, we applied reaction time tests and a speed test for a simple movement to two groups of children aged 9-11 years, one practicing sport outside the physical education classes, and the other not involved in extracurricular sports activities. Our goal was to highlight the differences between the left and right hands, both for the reaction and execution time, as well as the way in which the practice of a certain sport influences laterality.
Research Methods
The research subjects
The subjects of the research were students of the “Dante Alighieri” Theoretical High School, grades 3 and 4, aged 9-11 years. The tests were carried out during the school year 2017-2018, as follows:
Touch the Plates - 179 non-athlete children and 86 athletes;
Ruler Test - 143 non-athlete children and 73 athletes;
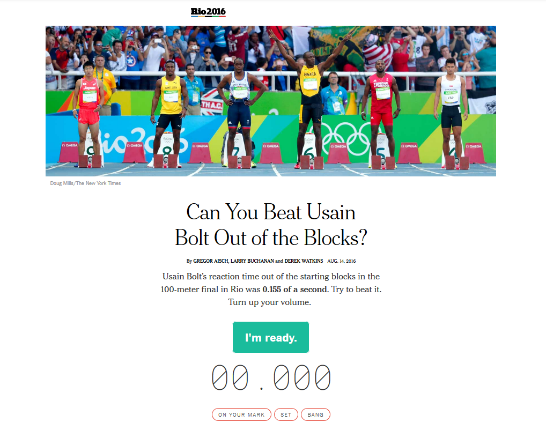
The online test “Can You Beat Usain Bolt Out of the Blocks?” (Aisch, Buchanan, & Watkins, 2016) issued in the New York Times - 44 non-athlete children and 29 athletes.
Test description
Touch the Plates. A 20 x 10 cm rectangle is drawn on a plate at a 15 cm distance from the long sides of the rectangle; in the middle of the sides, there are the centres of two circles with a radius of 5 cm marked on the right and left of the rectangle. The subject sits in front of this figure and places one hand in the centre of the rectangle, while the other is crossed over the fixed hand and performs a going back-and-forth movement between the two circles that must be touched as fast as possible; the time (in seconds, tenths and hundredths) in which the subject makes 25 going back-and-forth cycles is recorded.
Ruler Test. The subject is seated, with the elbow supported by the edge of a table so that the fist is beyond the edge of the table. The examiner holds a 40 cm ruler over the subject’s hand, the lower end of the ruler (zero division) being placed between the subject’s index and thumb. Unexpectedly, the examiner releases the ruler, and the subject has to catch it as fast as possible. Reading the length is done on the ruler at the index level, in centimetres, and the calculation of the simple reaction time (the time elapsed between the release of the ruler/the beginning of the fall and its grasping is done starting from the space law for the evenly accelerated movement, x = x0 + v0*t + a*t2/2, x – x0 = v0*t + a*t2/2; for v0 = 0, d = a*t2/2; because a = g in free fall, we get t = sqrt (2*d/g). Given the fact that sqrt(2/g) = 0.4515 (g = 9.81 m/s2), to obtain the time expressed in milliseconds, starting from the distance dr measured in centimeters, we used the calculation formula:
tr = 45.15* sqrt(dr) [ms] (1)
where: x0 and x = distance to time moments t0 and t; d = distance = x – x0; t = time; a = acceleration; g = gravitational acceleration; dr = distance travelled by the ruler in free fall, until the moment of grabbing; tr = reaction time
To determine the response time for visual and auditory stimuli, we used the “Can You Beat Usain Bolt Out of the Blocks?” test (Figure
Findings
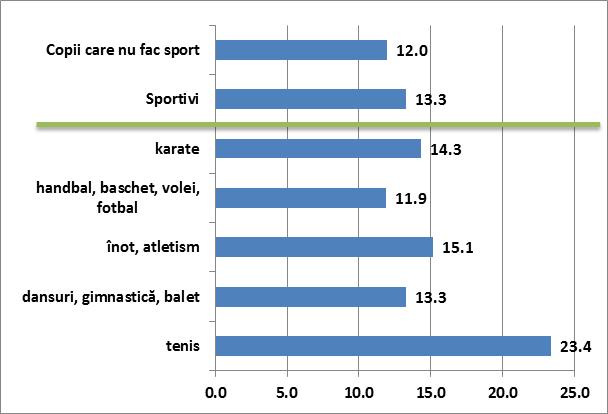
The Ruler Test was applied to 145 non-athlete children and 70 athletes practicing the following sports: karate (4 athletes), handball/basketball/volleyball/soccer (27), swimming/athletics (17), dance/ gymnastics/ballet (20) and tennis (2). For both athletes and non-athletes, the homogeneity of the groups is high both for the right hand test and the left hand test, the value of the coefficient of variation being less than 10% (Table
When applying the right hand test, athletes achieved a significantly better average time (214.6 milliseconds) than non-athlete children (226.0). The significant difference, given by the value of t calculated by applying the independent t-test, is 4.030, and the p-value is less than 0.05.
In the case of the left hand test, athletes achieved a significantly better average time (210.6 milliseconds) than the non-athlete children (225.0). The significant difference, given by the value of t calculated by applying the independent t-test, is 4.948, and the p-value is less than 0.05.
Analysing the difference between the results obtained for the right hand and the left hand, in absolute value, for athletes practicing handball, basketball, volleyball or football, the average difference (median value) has the smallest value (11.9), according to Figure
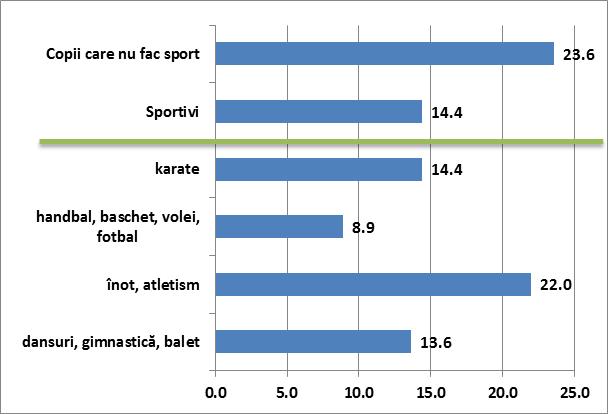
The Visual Response Time Test was applied to 43 non-athlete children and 29 athletes practicing the following sports: karate (1 athlete), handball/basketball/volleyball/soccer (8), swimming/athletics (13) and dance/gymnastics/ballet (7). The two groups are homogeneous with regard to the results obtained in both the right hand test and the left hand test, the value of the coefficient of variation being less than 35% (Table
When applying the right hand test, athletes have a better average response time (273.4 milliseconds) than non-athlete children (285.4). The difference is not statistically significant, the value of t calculated by applying the independent t-test is 1.414, and the p-value is higher than 0.05.
In the case of the left hand test, athletes have a better average reaction time (281.2 milliseconds) than non-athlete children (282.4). The difference is not statistically significant, the value of t calculated by applying the independent t-test is 0.118, and the p-value is higher than 0.05.
Analysing the difference between the left and right hand results in absolute value, athletes obtained smaller time differences for the right hand test and the left hand test (median value was 14.4 milliseconds) compared to non-athlete children (23.6). In the case of athletes who practice handball, basketball, volleyball or football, the average difference has the smallest value (8.9), as shown in Table
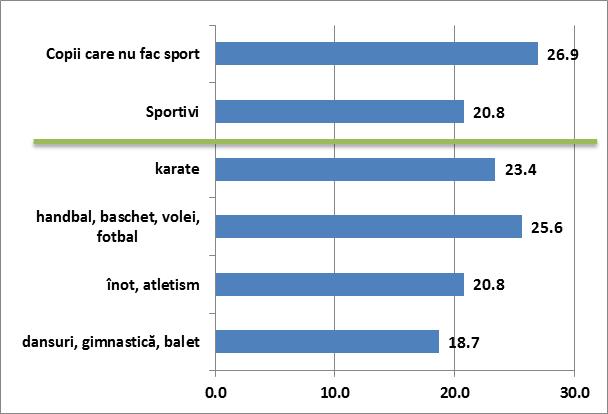
The Auditory Response Time Test was applied to 44 non-athlete children and 29 athletes practicing the following sports: karate (1 athlete), handball/basketball/volleyball/soccer (8), swimming/ athletics (13), dance/gymnastics/ballet (7). The two groups are homogeneous with regard to the results obtained in both the right hand test and the left hand test, the value of the coefficient of variation being less than 35% (Table
When applying the test to the right hand, athletes scored a better average response time (197.1 milliseconds) than non-athlete children (215.7). The difference is not statistically significant, the value of t calculated by applying the independent t-test is 1.764, and the p-value is higher than 0.05.
In the case of the left hand test, athletes have a better average response time (205.6 milliseconds) than non-sports children (219.3). The difference is not statistically significant, the value of t calculated by applying the independent t-test is 1.182, and the value of p is higher than 0.05.
Analysing the difference between the left and right hand results in absolute value, athletes obtained smaller time differences for the right hand test and the left hand test (median value was 20.8 milliseconds) compared to non-athlete children (26.9). In the case of athletes who practice dance, gymnastics or ballet, the difference has the smallest value (18.7), as shown in Table
The Touch the Plates Test was applied to 179 non-athlete children and 86 athletes practicing the following sports: karate (7), handball/basketball/volleyball/soccer (36), swimming/athletics/dance/ gymnastics/ballet (23) and tennis (2). The two groups are homogeneous with regard to the results obtained in both the right hand test and the left hand test, the value of the coefficient of variation being less than 35% (Table
In the case of the right hand test, athletes achieved a significantly better average time (10.41 seconds in 25 executions) than non-athlete children (11.81 s). The significant difference, given by the value of t calculated by applying the independent t-test, is 4.320, and the value of p is less than 0.05.
In the case of the left hand test, athletes achieved a significantly better average time (12.84 seconds in 25 runs) than non-athlete children (14.40 s). The significant difference, given by the value of t calculated by applying the independent t-test, is 4.409, and the value of p is less than 0.05.
Analysing the difference between the results obtained for the right hand and the left hand, in absolute value, for athletes practicing swimming or athletics, the average difference has the lowest value (median value is 2.19 s), according to Table
![Difference between the right and left hands in the Touch the Plates Test (time/25 executions
[s]) – Sports analysis](https://www.europeanproceedings.com/files/data/article/108/4505/ICPESK2018F080.fig.005.jpg)
Conclusion
The results show that differences in median and average reaction times recorded (or calculated, in the case of the Ruler Test) are very low between athlete and non-athlete groups, both in terms of comparison of times recorded in the right hand test (11, 12, 9 ms) and the left hand test (14, 1, 7 ms).
In the Touch the Plates Test, although the groups were homogeneous (CV <35%), the differences were significant (p <0.05, T = 4.320/4.404), both statistically and regarding the “quality” of execution, namely there were differences greater than 1 second between the two groups in the right and left hand executions. The left-right differences between the two groups are lower if medians are compared, and even higher, if averages are compared. The smallest difference has been achieved for swimming and athletics (cyclic sports in which the limbs are used approximately equally). The biggest difference has been in the case of tennis players, who obviously mostly use their favorite hand in the training.
In the case of the Ruler Test and the Visual Response Time Test, the smallest differences were recorded in children practicing ball sports (football, handball, basketball) and those practicing dance, gymnastics and ballet. In the case of the Auditory Response Time Test, the smallest differences were obtained for dance, gymnastics, ballet and swimming and athletics, their performance being dependent on the response to the auditory stimulus (music, start).
References
- Aisch, G., Buchanan, L., & Watkins, D. (2016). Can you Beat Usain Bolt Out of the Blocks? The New York Times. Retrieved from https://www.nytimes.com/interactive/2016/08/13/sports/olympics/can-you-beat-usain-bolt-out-of-the-blocks.html
- Child’s Play Therapy Center. (2014). What is bilateral coordination and why is it important? Retrieved from https://www.childsplaytherapycenter.com/bilateral-coordination-important/
- Goldman, J. G. (2014). Evolution: Why are most of us right-handed? Retrieved from http://www.bbc.com/future/story/20141215-why-are-most-of-us-right-handed
- Ostwald, S. K., Snowdon, D. A., Rysavy, S. D. M., Keenan, N. L., & Kane, R. L. (1989). Manual dexterity as a correlate of dependency in the elderly. Journal of the American Geriatrics Society, 37(10), 963-969.
- Schmidt, R. A. (1991). Motor learning & performance – From principles to practice. Champaign, Illinois: Human Kinetics Books.
- Sopa, I. S., & Pomohaci, M. (2015a). Developing and testing agility skills at primary school level. Paper presented at the 5th International Congress of Physical Education, Sports and Kinetotherapy “Education and Sports Science in 21st Century”, 10-13 June 2015, UNEFS Bucharest. Retrieved from http://www.unefs.ro/internationalcongress/archive/2015/Physical%20education.pdf
- Sopa, I. S., & Pomohaci, M. (2015b). Study regarding the difference of anthropometric development of children that practice sport compared with those that are sedentary. Analele Universității din Oradea, Fascicula Educație Fizică și Sport, XXV, 3-8.
- Sopa, I. S., & Pomohaci, M. (2015c). Testing the functional development of children that practice sport compared with sedentary children. The International Scientific Conference “Physical Education and Sports in the Benefit of Health”, 23rd October 2015, Oradea. Retrieved from https://www.researchgate.net/publication/283300217?channel=doi&linkId=5631dcc208ae506cea679d5a&showFulltext=true
- Stănescu, M. (2002). Educație fizică pentru preșcolari și școlari mici – o abordare psihomotrică. București: Semne.
- Tom’s Hardware. (2017). Monitors: Response time (in ms) and Hz are the same thing? Retrieved from http://www.tomshardware.co.uk/forum/id-3518237/monitors-response-time-thing.html
- Vasconcelos, O., Rodrigues, P., Barreiros, J., & Jacobsohn, L. (2014). Laterality, developmental coordination disorders and posture. In L. P. Rodrigues, J. Barreiros & O. Vasconcelos (Eds.), Estudos em desenvolvimento motor da criança (pp. 19-26). ESEIPVC.
- Woytowicz, E., Whitall, J. & Westlake, K. P. 2(016). Age-related changes in bilateral upper extremity coordination – Current geriatrics reports. New York: Springer Science + Business Media.
Copyright information

This work is licensed under a Creative Commons Attribution-NonCommercial-NoDerivatives 4.0 International License.
About this article
Publication Date
16 February 2019
Article Doi
eBook ISBN
978-1-80296-054-9
Publisher
Future Academy
Volume
55
Print ISBN (optional)
-
Edition Number
1st Edition
Pages
1-752
Subjects
Sports, sport science, physical education
Cite this article as:
Băițel, I., & Pătru, L. M. (2019). Influence Of Sport On Laterality In Children Aged 9-11 Years. In V. Grigore, M. Stănescu, M. Stoicescu, & L. Popescu (Eds.), Education and Sports Science in the 21st Century, vol 55. European Proceedings of Social and Behavioural Sciences (pp. 648-657). Future Academy. https://doi.org/10.15405/epsbs.2019.02.80