
Efficiency Analysis Of Free Zones And Strategy Policies

Abstract
Free Zones are defined as areas that are partially or totally exempt from legal and administrative regulations relating to many aspects such as commercial, financial and economic areas existing in the country. These areas are set up to promote industrial and commercial activities, export-oriented investment and production, accelerating foreign direct investment and technology transfer, directing exports to businesses and developing international trade (Ministry of Economy, Republic of Turkey). Sustaining the efficiency of Free Zones is crucial since they steer both regional and macro economies in the country. If a Free Zone is not able to provide the employees of its member firms with financial well-being and begin to rely on governmental bodies to operate, then it is very likely for that Free Zone to be a burden on the economy and become inefficient in terms of output/input ratio. In this study, a data envelopment analysis is applied to measure the efficiencies of 18 Free Zones in Turkey within the scope of a project conducted in partnership with the Eastern Black Sea Regional Development Administration (DOKAP) and policies are suggested as reflected by the sensitivity analyses of their respective mathematical models. 9 out of 18 Free Zones have been found inefficient, 3 of them showed a rate smaller than 20%. It is seen that most of the Free Zones are not at desired exportation levels. Moreover, some of them having the efficiency ratio closer to 1 actually do not have satisfactory export levels.
Keywords: Free zonesdata envelopment analysisstrategic managementforeign trade
Introduction
Free Zones are special areas where a more relaxed business environment is offered by government through specific tax exemption and various other incentives such as easy access to ports, freedom to operate like other national firms, discounted banking transactions, discounts or full exemption from value added taxes, prolonged stay of goods in ports, free use of convertible currencies, less restrictions on quality of goods and services, and making use of any other opportunities that are provided for local firms (Jenkins, 2005).
In Turkey, all kinds of activities such as research and development, manufacturing, software, general trading, storing, packing, banking and insurance can be performed within Free Zones. Investors can benefit from rented offices and warehouses, joint ventures of foreign companies can benefit from all the advantages that are open to the Turkish private sector, and they can also enjoy great discounts that are provided to promote trade volume. If they are managed successfully, they can also be used for political purposes (Jenkins, 2005).
First attempts to set up Free Zones managed to bear fruit in 1985 and Mersin, Antalya, and Ege Free Zones were established in the following two years. Data regarding their establishment and generation are provided in Table
Data envelopment analysis (DEA) is used extensively for making decisions on a non-parametric basis where decision makers seek for a point beyond which a decision unit is considered satisfactory or unsatisfactory based on some criteria. Studies and concepts are provided in Section
Conceptual Framework and Previous Work
Literature reviews yield that the FZs are not homogeneous and there are different types of them even in the same country. Although this leads to a complex structure, all FZs can be classified into the group of "Special Economic Zone". The regions under the title of Special Economic Zone continue to operate under different names such as Free Trade Zone, Export Based Free Zones, Free Ports, and Free Investment Zones. In Turkey, the Ministry of Economy uses the definition of "Free Zones" and all FZs have similar characteristics.
The development of FZ concept is closely related to the fact that countries begin to pursue more liberal policies. In developing countries such as South Korea, Taiwan, Malaysia, China and India, economic freedom within zones and regions have gradually expanded and spread to other countries over time. Number of FZs, an important tool of global economic policy, reached 450 in 80 countries in 1980s (Tumenbatur, 2012), while in 1999, it reached 3,000 regions in 116 countries around the world, with about 43 million people working (eceonomywatch.com). There are 4300 Special Economic Zones in the world according to data from The Economist, 2015.
In Turkey, the self-enclosed economic structure continued until 1980s, after which it shifted to trade policies focusing on export (Tumenbatur, 2012). FZs have come to the agenda again in developing foreign trade and meeting foreign exchange needs. The development of FZs was legitimated by FZ Law No. 3218 dated 15.06.1985. The first FZs established in Turkey after the law were Mersin and Antalya FZs. The total trade volume of 18 FZs in 2016 is 19 billion dollars and the total number of employees exceeds 66 000 (Ministry of Economy). 7.7% of Turkey’s export comes from FZs by the end of 2016.
There are also studies regarding the negative impacts of FZs on socio-economic structures of countries such as uncontrolled population increase, lack of necessary housing and irregular urbanization (Bakan & Gokmen, 2014). They are also criticized in terms of regional trade imbalance and increase in imports rather than exports. Studies regarding impacts of FZs include foreign capital, competitiveness, export and employment (Young & Miyagiwa, 1987; Peng & Vellenga 1993; Manezhev, 1995; Bolin, 1997; Wei, 1999; Marangoz & Icerli, 2000; Haywood, 2004). More analyses can be seen in Hamada (1974), Hamilton and Svensson 1982, Young (1987), and Chaudhuri and Adhikari (1993).
In Turkey, studies argue that FZs increase domestic trade rather than global (Kocaman, 2007; Atik, 1998), that their impact is very low on foreign trade (Bakan, 2014; Arslan & Yaprakli, 2007), and that interest in them will decrease by increasing globalization (Ozturk, 2013). Further studies can be found in Karaduman ve Yildiz (2012), Kadi (2015) regarding impacts in different dimensions, and in Bakan and Gokmen (2014) for Gaziantep FZ, in Hava (1999) for Ege FZ, in Akova (1999) for Mersin FZ, in Ay (2009) for Bursa FZ and in Orhan (2003) for Kocaeli FZ.
As for efficiency measures, Kabakoz (2012) develops a regression analysis while Kavlak (2012) provides a basis for evaluating visionary efficiency of Free Zones. Demirci and Tarhan (2016) provides a CCR and BCR based approach to determine the efficiencies of FZs, which we also made use of in evaluating our own inputs and outputs. The emergence of DEA is based on the linear programming concept known as the CCR model of Charnes, Cooper and Rhodes (CCR Model) (1978) in 1978. In 1984, Banker, Charnes and Cooper developed the BCC model (1984), another basic model of the DEA. Details regarding theoretical framework may be found in Ray (2004), Molinero and Woracker (1996) and Cooper, Seiford, & Tone (2007). In the linear programming model for each decision unit, the ratio of each variable is located between 0 and 1. Decision units equal to 1 are considered as effective while those less than 1 are considered as inefficient. The mathematical model of DEA that we employed in our study is given by (
subject to
where hk denotes the efficiency of decision unit k, urk denotes the weight for output r of decision unit k, vik denotes the weight for i of decision unit k. Xs and Ys denote the respective current values of ith input and rth output of respective decision units. There are s different outputs, m different inputs and n different decision units. The is called the Non-Archimedean epsilon and handles the infeasibility/unboundedness cases. For more applications, see Peker and Baki (2009), Demirci and Tarhan (2016) and Akyurek (2017).
Research Method
This section provides information about how data is collected regarding the Free Zones and the mathematical model that we employed in evaluating the efficiencies for each of the Free Zones.
Determination of Inputs, Outputs and Decision Units for Data Envelopment Analysis
We will be considering 18 Free Zones that are actively working and have the associated FZ status as reported by the Ministry of Economy. In this research, the primary data was collected from 33 face-to-face, in-depth semi-structured interviews that were conducted with managers of FZ firms (11), related regional directorates of the Ministry of Economy (10) and operator firms of FZs (8) to obtain empirical data related to all inputs and outputs. For laws and regulation, a total of four experts and managers were interviewed in the Ministry of Economy. The main reason for conducting these interviews is to have a holistic understanding of FZs’ modus operandi. Moreover, three different sets of questionnaire were developed, thus a diverse set of stakeholders also served as a source of information to provide a complete picture of FZ ecosystem in Turkey. General scope of the interviews can be summarized in seven different categories: (i) FZ SWOT analysis, (ii) success criteria, (iii) legislative framework, (iv) effectiveness, (v) cooperation, (vi) benchmarking, and (vii) suggestions and remarks. The criteria for the selection of Free Zones to consider in this study are based on trade volume (export and import rates), level of institutionalism, industrialization, location, and sectorial concentration.
Since phone interviews can be regarded as secondary to face-to-face interviewing, arranged phone interviews were made for additional information regarding Input 1. Furthermore, website research is used to obtain secondary data such as mission, vision and other published strategic documents. Surveys and phone interviews as well as literature benchmarks yielded 4 types of inputs and 2 types of outputs, which are provided in Figure
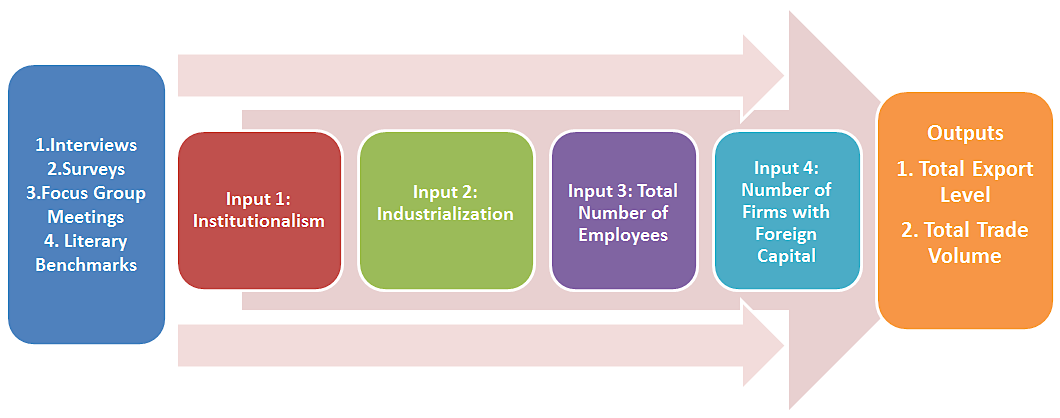
Institutionalism level is determined by allocating a weighted value to each of the sub-factors and then averaging them. Credits are allocated by six experts of Turkish Institute of Industrial Management (TUSSIDE). The specialization areas of the experts are strategic management, regional competitiveness, free zones, regional economic development, industrial and technological structures and location selection analysis.
Institutionalism is evaluated based on organization chart, availability of statistical database, having a mission/vision statement on their websites, ISO quality certifications, professional website, membership for local and global trade associations, participation in conferences, and membership in WEPZA (World Economic Processing Zones Association) and World Free Zone Organization (World FZO). Industrialization is determined by the number of firms in a Free Zone, whereas total number of employees refers to total labour force. Input 4 includes both the firms with 100% foreign capital and/or firms as partner companies with local firms. Our outputs are defined as total export volume defined as the monetary value of any goods and services exported abroad and total trade volume, which, in addition to export volume, also covers purchasing activities and financial values of transactions.
Solving the Mathematical Model of DEA and Computing Efficiencies
The mathematical model given also in (
Accordingly, Denizli, TUBITAK Marmara and Izmir Free Zones are the most inefficient Free Zones with their respective rates of 0.06, 0.08, and 0.16. Adana Yumurtalık, AHL, Avrupa, Bursa, Ege, Mersin, Rize, Trabzon, and Istanbul Industry and Trade are determined as efficient based on our model and available data.
Findings
Table
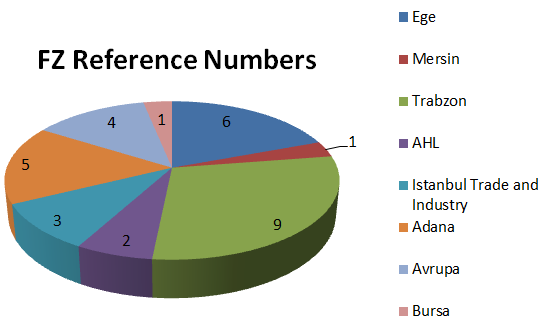
Based on the sensitivity analysis reports as a result of the solutions of our mathematical models, inefficient Free Zones yielded their reference FZs, whose frequencies are provided in Figure
We also obtain the percentages for increases in export level and total trade volume by solution dairies of our mathematical problems. The percentages are given in Table
Accordingly, only Trakya and Antalya Free Zones are required to increase their export levels by less than 100% to be considered as efficient. It should be noted that these increases show marginal increases in the related output, meaning that a Free Zone should increase only its respective output level by that percentage to be considered efficient. For example, Antalya Free Zone can reach the efficient state by increasing its export level by 80.43%, or by increasing its total trade volume by 137%. Since increases in export level would also mean increases in total trade volume, and since two output types have some correlation between them, it is possible for a particular Free Zone to be efficient by increasing its output levels much less than what is required in Table
Conclusion and Further Discussion
Free Zones are special areas where a more relaxed business environment is offered by government through specific tax exemption and various other incentives from easy access for ports to discounts or full exemption from value added taxes, prolonged stay of goods in ports, free use of convertible currencies and less restrictions on quality of goods and services. Since they are in pioneering roles in boosting economy, their efficiency plays a vital role especially in labour force and production context. This study differs from other studies in that it incorporates mathematical modelling concept into data envelopment analysis where the methodology is applied to Free Zones. Data availability was very important to conduct the analyses, which, most of the time, restricts the decision makers from doing a comprehensive research. As for outputs, we directly considered export and total trade in order to evaluate FZs in economical basis, and we included multiple inputs and outputs in our model. An extension of this study may be including other output factors such as employment, which is originally an input. Further studies may as well consider regional dynamics as total trade volume largely depends on various factors such as regional development and proximity to in-ports and ports. As for our case, we did not consider regional development on purpose, aiming to seclude the study from very high variances caused by different scales and very different aspects of FZs within the same region.
A difficulty for the study was to determine the correct Non-Archimedean epsilon which can make a problem infeasible or cause some variables to take negative values if not defined. Sometimes we had to make the number so small in order for the problem to be feasible, and we relaxed the assumption of infeasibility in order to evaluate all FZs according to larger acceptable range. Rize FZ, as a result, proved inconsistency because, even if the efficiency rate is 1, number of employees is less than 10, and the model assigns the larger weight to this input, leading to efficiency. In fact, Rize does not have a managing firm and is ruled by the regional directorate of the Ministry of Economy, and the number of employees does not refer to real employment data, and since their export rates are actually low, they should be labelled as inefficient. That applies to Trabzon FZ as well, where a single firm is considered to evaluate the efficiency of a whole FZ. This means that we should have additional information regarding our decision units even though we have the data and are ready for analysis, and we should evaluate inputs and outputs within acceptable ranges excluded from mathematical model as well.
References
- Akova, S.B. (1999). Mersin Serbest Bolgesi Ozellikleri, Etkileri ve Etkilendigi Cografi Kosullar. Cografya Dergisi, 7,151-182.
- Akyurek, E. (2017). Turkiye’de Karadeniz Limanlari Verimlilik Analizi. Verimlilik Dergisi, 4:29-45.
- Arslan, I., Yaprakli, S. (2007). Serbest Bolgelerin Ekonomik Etkileri. Gaziantep Universitesi Sosyal Bilimler Dergisi, 6(2), 91-102.
- Atik, A. H. (1998). Serbest Bölge ve Türkiye’de Serbest Bölgeler. Türkiye Kalkınma Bankası Araştırma Müdürlüğü, Ankara.
- Ay, S. (2009). Serbest Bolgelerin Ekonomik Etkileri: Turkiye’deki Serbest Bolgelerin ve Bursa Serbest Bolgesinin Ticaret Hacmi, Istihdam ve Yabanci Sermaye Acisindan Degerlendirilmesi. Is, Guc Endustri Iliskileri ve Insan Kaynaklari Dergisi, 11(3), 31-46.
- Bakan, S., & Gokmen, S. (2014). Serbest Bolgeler ve Dis Ticaret Iliskisi: Gaziantep Serbest Bolgesi Ornegi. Elektronik Sosyal Bilimler Dergisi, 13(51), 34-51.
- Banker, R.D., Charnes, A., & Cooper, W.W. (1984). Some Models for Estimating Technical and Scale Inefficiencies in Data Envelopment Analysis. Management Science, 30(9), 1078-1092.
- Bolin, R.L. (1997). Export Processing Zones Move to High Technology (How Can Government Assist?) Taken from: http://www.wepza.org/publications.html
- Chaudhuri, T.D., & Adhikari S. (1993). Free Trade Zones with Harris-Todaro Unemployment: A Note on Young-Miyagiwa. Journal of Development Economics, 41,157-162.
- Charnes, A., Cooper, W.W., Rhodes, E. (1978). Measuring the Efficiency of Decision Making Units. North-Holland Publishing Company, European Journal of Operational Research, 2(6), 429-444.
- Cooper, W.W., Seiford, L.M., Tone, K. (2007). Data Envolepment Analysis. Springer, 2007, USA.
- Demirci, A., & Tarhan, D.B. (2016). Serbest Bolgelerin Dis Ticaretteki Onemi ve Turkiye’deki Serbest Bolgelerin Etkinliklerinin Veri Zarflama Analizi Ile Incelenmesi. Toros Universitesi IISBF Sosyal Bilimler Dergisi, 6, 31-53.
- Economy Watch, International Free Trade Zone. (22.11.2017). Retrieved fromhttp://www.economywatch.com/international-trade/free-trade-zone.html
- Hamada, K. (1974). An Economic Analysis of the Duty- Free Zone. Journal of the International Economics, 4, 225-241.
- Hamilton, C., Svensson L. (1982). On the Welfare Effects of a Duty-Free Zone. Journal of International Economics, 13, 45-64.
- Hava, H. T. (1999). Serbest Bolgeler ve Ege Serbest Bolgesi: Bir Durum Degerlendirmesi. Dokuz Eylul Universitesi IIBF Dergisi, 14(1), s.113-124.
- Haywood, R.C. (2004). Developing Trade Capacity Through Free Zones. Journal of The Flagstaff Institute, 28 (1): 43-52.
- Jenkins, M. (2005). Economic and Social Effects of Export Processing Zones in Costa Rica. Geneve: ILO Working Paper 97. Taken from: http://www.ilo.org/empent/Publications/WCMS_101038/lang--en/index.htm
- Kabakoz, S. (2012). Türkiye’deki Serbest Bölgelerin Performans Açısından Değerlendirilmesi. Unpublished master's thesis, Kocaeli Üniversitesi Sosyal Bilimler Enstitüsü, Kocaeli.
- Kadi, F. (2015). Serbest Bolgede Faaliyet Gosteren Firmalarin Tercih Nedenleri: Istanbul Ataturk Havalimani ve Istanbul Trakya Serbest Bolgesi Baglaminda Bir Inceleme. Eskisehir Osmangazi Universitesi, IIBF Dergisi, 10(3), 165-176.
- Karaduman, N., Yildiz Z. (2002). Serbest Bolge Uygulamalarinin Dis Ticarete ve Yabanci Sermayeye Katkilari. Suleyman Demirel Universitesi IIBF Dergisi, 7(1), 133-152.
- Kavlak, M. E. (2012). Economic Impacts of Free Zones In Turkey: A Questionnaire Study Conducted with Firms Operating in Turkish Free Zones Regarding The Perception Of The Firms On The Success Of Free Zones. Unpublished doctoral dissertation. Orta Dogu Teknik Universitesi, Ankara.
- Kocaman, Ç. B. (2007). Serbest Bölgelerin Makroekonomik Etkilerinin Değerlendirilmesi: Türkiye Örneği. Ankara Hukuk Fakültesi Dergisi, 56(3), 99-136.
- Marangoz, M., & Icerli, M.Y. (2000). Ege Serbest Bolgesi’nin Izmir’in Sosyo-Ekonomik Yapisi Uzerine Etkileri Konusunda Bu Bolgede Calisanlarin Dusuncelerinin Ogrenilmesine Yonelik Bir Arastirma. Dokuz Eylul Universitesi Sosyal Bilimler Enstitusu Dergisi, 2(2), 181-191.
- Manezhev, S.A. (1995). Free Economic Zones and the Economic Transition in the Chinese People’s Republic and Russia. Russian and East European Finance and Trade, 31(2), 76-87.
- Molinero, C.M., & Woracker, D. (1996). Data Envelopment Analysis: A Non-mathematical Introduction. Operational Reserach Society, 9(4), 22-28.
- Orhan, A. (2003). Serbest Bolgelerin Sagladigi Avantajlar: KOSBAS Ornegi. Kocaeli Universitesi Sosyal Bilimler Enstitusu Dergisi, 5, 117-131.
- Ozturk, L. (2013). Serbest Bolgelerin Gelecegi: Turkiye Acisindan Bir Degerlendirme. Uluslararasi Yonetim Iktisat ve Isletme Dergisi, 9(19), 76-84.
- Peker, I., & Baki, B.(2009). Veri Zarflama Analizi Ile Turkiye Havalimanlarinda Bir Etkinlik Olcumu Uygulamasi. C.U. Sosyal Bilimler Enstitusu Dergisi 18(2), 72-88.
- Peng, L.D., & Vellenga, D. (1993). The Goverment’s Roles in Promoting Logistics Services in China. Lojistics and Transportation Review, 29(4), 301-318.
- Ray, S.C. (2004). Data Envelopment Analysis: Theory and Techniques for Economics and Operations Research. Cambridge University Press, USA.
- The Economist, Special Economic Zones Not so Special. (15.12.2017). Retrieved from:
- https://www.economist.com/news/leaders/21647615-world-awash-free-trade-zones-and-their-offshoots-many-are-not-worth-effort not performance. Entrepreneurship Theory and Practice, July, 635-657.
- Tumenbatur, A. (2012). Serbest Bolgeler ve Turkiye Ekonomisine Katkilari Uzerine Bir Degerlendirme. Cukurova Universitesi Sosyal Bilimler Enstitusu Dergisi, 21(3), 339-356.
- Young, L., & Miyagiwa, K. (1987). Unemployment and the Formation of Duty Free Zones. Journal of Development Economics, 26(2): 397-405.
- Wei, G. (1999). The Dynamics Of Export-Processing Zones. UNCTAD Discussion Papers, No: 144. Retrieved from: http://www.unctad.org/en/pub/pubframe.htm
Copyright information

This work is licensed under a Creative Commons Attribution-NonCommercial-NoDerivatives 4.0 International License.
About this article
Publication Date
28 January 2019
Article Doi
eBook ISBN
978-1-80296-053-2
Publisher
Future Academy
Volume
54
Print ISBN (optional)
-
Edition Number
1st Edition
Pages
1-884
Subjects
Business, Innovation, Strategic management, Leadership, Technology, Sustainability
Cite this article as:
Çal, M., Kandemir, A., Saygılı, C., & Bayraktar, C. (2019). Efficiency Analysis Of Free Zones And Strategy Policies. In M. Özşahin, & T. Hıdırlar (Eds.), New Challenges in Leadership and Technology Management, vol 54. European Proceedings of Social and Behavioural Sciences (pp. 1-10). Future Academy. https://doi.org/10.15405/epsbs.2019.01.02.1