Numerical Estimation Abilities In Russian School-Age Children: Evidence Of Exponential Growth
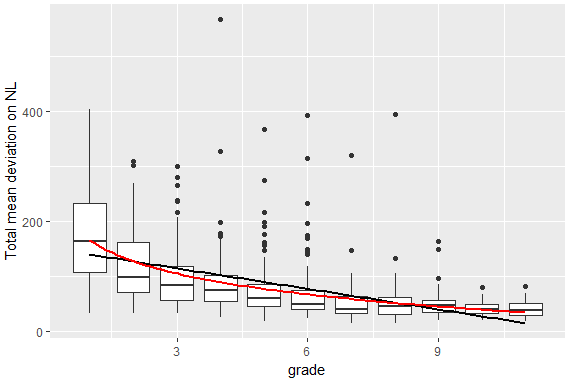
Figure 1: NL scores by grade. NL scores in each grade are represented by boxplots, with a linear regression line (in black) and an exponential regression curve (in red).