
Differences On The Upper Quarter Y Balance Test Among Young People


Abstract
Upper Quarter Y-Balance Test is a closed kinetic chain assessment of upper quarter mobility and stability using a functional testing device. We started with the question: Are there significant differences in the bilateral upper limbs UQYBT results, recorded by the subjects engaged and not engaged in recreational physical activities? The study identifies bilateral movement limitations and asymmetries in active and not-active young people on shoulder stability and mobility as a closed kinetic chain upper extremity. The subjects are 93 young students (45 females and 48 males), 22.19 average age. They are organised in four groups: not-active and active (females and males). UQYBT is applied on all four groups of subjects. Mathematics methods as One Way ANOVA for Dependent samples and Post ANOVA Tukey HSD Test were used to identify the significant statistic differences between groups. The comparative analysis between active versus not-active groups suggests not significant statistic differences for males. For the female groups, there are not statistically significantly differences, with a few exceptions. There were statistically significantly differences, to benefit the active group, for the right upper limb (SL direction) and for the left upper limb (IL direction). The main conclusion is that UQYBT may be useful in assessing functional deficit in upper extremity stability.
Keywords: Young peoplemobilitystabilityUQYBT
Introduction
There are some factors which contribute shoulder mobility and its stability. Mobility is influenced
by type of joint and articular disc. Stability is influenced by the strong of capsule and ligaments. Joint
mobility is the range of movement around joint. Stability is the ability to maintain and control joint
position and movement. Normal limits of mobility and stability ensure active live and prevent injuries and
provide best function and high performance.
The shoulder is a complex joint that ensures adequate stability and full mobility. The upper limbs
joint the skeleton thoracic and form the shoulder. This is complex mechanical system in the human body,
consisting of bones: the scapula, humerus and clavicle. “These bones interact with each other through
three joints: sternoclavicular, acromioclavicular and scapulothoracic” (Posea & Pasol, 2014).
The sternoclavicular joint provides the movements of the upper limb, and has a high degree of
mobility. This joint provides much stability, as it is the only connection between the upper limb and the
axial skeleton. The scapulothoracal articulation is joints the scapula and dorsal thorax. It is not a true
anatomic joint because it lacks a synovial capsule and there are between the anterior surface of the
scapula and the thorax. “The acromioclavicular joint is a diarthrodial joint between the medial clavicular
facet of the acromion and the distal clavicle. Muscles that cross the joint are Deltoid and Trapezius and
provide dynamic suspensory support” (Nenciu, 2014).
“The interaction between bones produces smooth coordinated movements of the shoulder, such as
reaching; alterations in the position and/or orientation of any of these joints and articulation may interfere
with optimal shoulder coordination” (Amasay and al. 2016). “There is a wide range of shoulders
movement: extension, flexion, abduction, adduction, internal rotation, external rotation” (Sidenco, 2012).
Problem Statement
Gorman and al. (2012) found that “the examination of gender (aged 19-47 years) differences on
the UOYBT revealed no statistically significant differences between men and women for any of the 3
reach directions. The highest scores were recorded for the medial reach, followed by the inferolateral
reach, and then the superolateral reach”. Amasay and al. (2016) underline that in their study the
participants achieved the highest scores during the MR, followed by the ILR, and the lowest scores during
the SLR in both groups the SDK and normal shoulders.
Butler and colleagues (2014) used the UOYBT for collegiate swimmers. No differences were
observed for reach symmetry in any direction. Further, performance on several UOYBT indices was
worse for female than male collegiate swimmers. The test results may have implications for the use of
preseason and return-to-sport testing in swimmers as a measurement of upper quarter function and
symmetry.
Literature points to a higher recurrence rate of the young people and increase functional
impairment in instability that could provoke hyperlaxity of bone and bone injuries. Robinson et al. (2006)
demonstrated that young people and males are more exposed to recurrent shoulder instability. More they
found out that “86% of patients aged 15-20 and 71% aged 21-25 who suffered a primary traumatic
anterior shoulder dislocation, experienced recurrent instability after 3 to 5 years”.
Repeated overhead sports are not indicated on the surgery repaired unstable shoulder. Park et al.
(2013), show that “only 50% of elite athletes overhead sports returned to play at their previous level after
surgery repaired unstable shoulder; in their experiences managing the expectations of the athletic patients
with shoulder instability can be difficult”.
The results of Zahar et al. (2012) study suggest “that patients with shoulder impingement
syndrome will perform worse on the UQYBT in the medial and inferolateral directions than healthy
controls. Thus, upper extremity closed kinetic chain exercises should be added in shoulder rehabilitation
programs”.
Heinbaugh et al. (2015) investigated the effect of time-of-day (morning vs. afternoon) on static
and dynamic balance in recreational athletes. Time-of-day had a minimal effect on dynamic balance and a
noticeable effect on static balance. So, the authors considered that “time-of-day may be a factor in
designing balance training programmes and intervention studies for recreational athletes”.
The objective of Myers et al. study (2015) was to compare performance on the UQYBT between
athletes, whose sport requires some degree of closed chain activity (wrestlers), and athletes whose sport is
primarily open kinetic chain in nature (baseball players). The findings suggest that wrestlers perform
better on the UQYBT than baseball players. The conclusion of their study may suggest a sport specific
normative data for the UQYBT in high school athletes.
Borms et al. (2016) investigated the relationship between isokinetic strength testing for shoulder
and elbow and UQYBT performance in overhead athletes. Performance on the UQYBT did not seem to
be related to upper limb strength. It can help determine rehabilitation goals for injured overhead athletes
because no differences were found in the dominant and not dominant limbs in population of healthy
overhead athletes.
Borsa et al. (2008) point that overhead athletes require a delicate balance of shoulder mobility and
stability in order to meet the functional demands of their respective sport. Altered shoulder mobility has
been reported in overhead athletes and is thought to develop secondary to adaptive structural changes to
the joint resulting from the extreme physiological demands of overhead activity.
Research Questions
We base our research on the following hypotheses:
�Are there significant differences in the bilateral shoulder UQYB test results (right shoulder
versus left shoulder) recorded by the subjects engaged in recreational physical activities?
�Are there significant differences in the bilateral shoulder UQYB test results (right shoulder
versus left shoulder) recorded by the subjects not engaged in recreational physical activities?
�Are there significant differences between the UQYB test results recorded by the subjects
engaged in recreational physical activities and the ones obtained by the subjects who do not
pursue such activities?
Purpose of the Study
The purpose of the study is to report the differences in the Upper Quarter Y Balance Test results
recorded by the young people. The study identifies bilateral movement limitations and asymmetries in
active and not-active young people on shoulder stability and mobility as a closed kinetic chain upper
extremity.
Research Methods
Subjects
The research is based on specialist literature. 93 students (45 females and 48 males), average age
22.19 participate in the study. Some of them engage in recreational physical activities, while others don’t.
The subjects are organised in not-active and active groups (women and men). All the subjects test the
shoulder stability and mobility as a closed kinetic chain.
Test
The protocol for the Upper Quarter Y Balance Test (UQYBT) is applied on all four groups of
subjects. The UQYBT tests the individual’s ability to execute a bilateral task while maintaining 3 points
of contact (1 hand and 2 feet) with the ground in a plank position and feet shoulder-width apart. The
starting position was defined as the feet placed shoulder-width apart in a push up position with the tested
limb on the stance platform and the thumb adducted and aligned behind the red line. The reach hand was
positioned on top of the reach box shoulder width from the stance hand. The test consisted of 3 trials.
Each trial required the athlete to reach in 3 directions, (medial, superolateral and inferolateral), with the
free hand pushing the box by contacting only the side of the box in the area of the red tape before
returning to the starting position in a controlled manner.
Organisation
The results are included in a table and statistically processed. The four groups are statistically
characterised by mean and the homogeneity level. Intra and intergroup comparative analyses are
conducted. The bilateral limbs test results for the three directions – Medial reach direction (M),
Superolateral reach direction (SL) and Inferolateral reach direction (IL) – are compared. The comparative
analysis is conducted within the group using the One Way ANOVA for Dependent samples method.
Another test – Post ANOVA Tukey HSD Test – is employed to establish the relevance of the differences
found. The two methods identify the statistical differences between the compared results recorded by the
subjects of the four groups. Other series of comparative analyses are conducted to establish the relevance
of the results recorded by the active and not-active groups (females and males). The same mathematical
and statistical methods are used.
Findings
Findings on groups:
Female – not-active group
Anthropometric findings
There are 25 subjects in the not-active group. The women are healthy and have not suffered any
injuries in the last months. The average age of the group is 22 years old, the oldest subject being 28, while
the youngest, 18. The average height is 165.48 cm, while the average weight is 59.60 kg. The body mass
index is 21.51 kg/m2, a value that places the subjects in the normal reference weight values, in relation to
their age.
Upper Quarter Y Balance Test
Upper limb - right. The highest average value of the right upper limb performance is recorded for
the M direction (88.03 cm), the opposite average value being recorded for the SL direction (56.37 cm).
The highest homogeneity level is recorded for the M direction (Cv = 8.08%). For the SL direction, the
individual values reflect the lack of homogeneity (Cv = 25.06%). The average IL values reflect medium
homogeneity. For the right upper limb, the best individual value recorded within the women’s group is
103.00 cm for the M direction. The lowest individual value for the same limb is 35.99 cm for the SL
direction.
Upper limb - left. The highest average value of the left upper limb performance is recorded also
for the M direction (88.87 cm), the opposite average value being recorded also for the SL direction (58.41
cm). The highest homogeneity level is recorded for the M direction (Cv = 9.98%). For the SL direction,
the individual values reflect the lack of homogeneity (Cv = 21.89%). The average IL values indicate
medium homogeneity. For the left upper limb, the best individual value recorded within the female’s
group is 100.00 cm for the M direction. The lowest individual value for the same limb is 31.00 cm for the
SL direction.
The analysis of the average values recorded by the not-active female’s group for the upper limbs
(right limb vs. left limb), reflects differences between the upper limbs for the three similar directions. The
lowest difference is recorded for the M direction (0.79 cm). For the other two directions (SL and IL), we
find differences of 2 to 3 cm. The Critical ANOVA Tukey Test indicates differences not significant for
bilateral upper limbs for the three directions – M, SL and IL, while considering the 0.01 and 0.05
confidence intervals. There are no differences on composite scores on not-active female’s group for the
bilateral upper limbs
Female – active group
Anthropometric findings
The active group consists of 23 young females. All of them are healthy and no pathological events
are recorded in the last 6 months. The average age of the group is 21.16 years. The oldest subject is 26
years old, while the youngest is 19. The average height at the group level is 167.16 cm. The average
weight is 57.58 kg. The body mass index is 20.63 kg/m2, a value that places the subjects in the reference
weight values, in relation to their age.
Upper Quarter Y Balance Test
Upper limb - right. M direction reach average that measures 90.16 cm is the best result for right
limb. The opposite average value is for the SL direction (67.16 cm). On M direction the group has high
homogeneity level (Cv = 8.97%). For the SL direction, the individual values reflect the lack of
homogeneity (Cv = 25.06%). The group has no homogeneity on SL direction and medium homogeneity
for IL direction reach. The best individual value recorded within the female’s group is 102.00 cm for the
SL direction and the lowest individual value for the same limb is 44.99 cm for the SL direction.
Upper limb - left. The results for left upper limb show the best average for M direction with 93.50
cm, but the lowest average is recorded on SL direction (63.75 cm). The active group has high
homogeneity (Cv = 7.73) on M direction and medium homogeneity for the last two directions. The best
individual result recorded within women’s active group is 105 cm on M distance reach, and the opposite
individual value for the same group is 40 cm on SL direction.
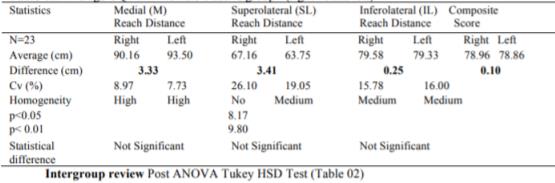
The analysis of the average values recorded by the active women’s group for the two event series
(right upper limb vs. left upper limb), reflects differences between the upper limbs for the three similar
directions. For the M direction, the difference is 3.33 cm, for the SL direction, the difference is 3.41,
while for the IL direction, we notice a 0.25 cm difference. The Critical ANOVA Tukey Test indicates no
significant differences between the upper limbs for the three directions – M, SL, and IL. There are not
statistically significant differences in composite scores.
Males – not active group
Anthropometric results
The not-active group has 26 subjects, who are clinically healthy, with a clear medical bill for the
last 6 months. The average age of this group is 22.45, with a maximum age of 29 and a minimum of 19.
The average body height is of 175.10 cm with a medium weight of 74.65 kg. The body mass index is
24.50 kg/m2. The not-active group is within the normal limits of the body weight.
Upper Quarter Y Balance Test
The upper – right. The highest average value for the M direction is 102.00 cm, while the lowest
average value for the SL direction is 79.04 cm. For IL, the group average is 87.75 cm. Homogeneity of
the group can be noticed for all directions, with the variability coefficient oscillating between 6.34 and
8.20, an interval that indicates a very low good dispersion of the individual values. The best individual
result of the not-active male group is 109.00 cm on the M direction. For the same right limb, the lowest
individual value is 78.00 cm for SL.
Upper limb – left. Among all three directions, the highest average value is still on M (97.95 cm),
while the lowest average value is on SL (76.65 cm). Homogeneity is good on all the directions in the
upper left limb. The longest individual distance has been obtained for the left arm on the M direction
(105.00 cm). At the opposite end, the lowest individual value is 66.00 cm on SL.
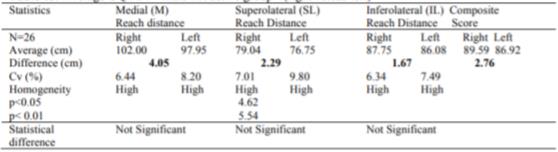
The comparison refers to the not-active male group, between the average values for the upper
limbs (right versus left) for all three directions: M, SL and IL distance, as per the UPPER QUARTER Y-
BALANCE test. We notice small differences between the two segments, on all directions: Medial =4.05
cm; SL =2.29 cm; IL =1.67 cm. When applying the Critical ANOVA Turkey test, it is confirmed that the
differences coming from right versus left, for the directions M, SL and IL are insignificant, at the trust
threshold 0.01 and 0.05. It seems that the composite scores indicate no significant differences in bilateral
upper limbs for not active male group.
Males – active group
Anthropometric results
The active group is made of 22 young males, clinically healthy. The average age of this group is
23.15, with a variation between 29 and 19. The average body height is 179.10 cm and the average weight
is 78.75 kg. The body mass index is 24.70 kg/m2, and this average value indicates a normality of the
body weight in the active group.
Upper Quarter Y Balance Test
Upper limb – right. M= 105.56 cm is the best result on all three directions. The average value of
80.26 cm describes the group for the direction SL (91.69 cm). The active group is homogeneous on all
directions, where Cv has values under 10 %. The best individual result is 119 cm on M direction, and the
worst is 71.00 cm on SL direction.
Upper limb – left. The average value is still on direction M (103.26 cm); for the same group, the
average value is the lowest on SL direction (75.95 cm). Homogeneity is good only on direction M (Cv =
9.76%). For the other directions, homogeneity is average. The best individual result was for the left arm
on SL (118.00 cm), opposed to 54.00 cm on the direction of SL.
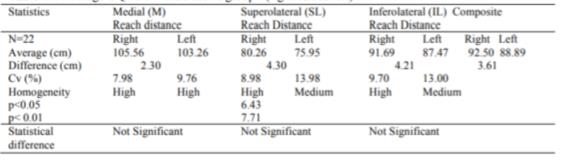
The comparison between the upper limbs, right versus left, takes into account the results obtained
on all three directions: M, SL and IL. While comparing the average values, there are small differences
between the upper right and left limbs: Medial=2.30 cm; SL =4.30 cm; IL=4.21 cm. The critical ANOVA
Turkey test confirms the fact that the differences noticed for the superior right and left limb, for the M, SL
and IL directions are not statistically significant for bilateral upper limbs. The composite scores don’t
indicate significant differences in bilateral upper limbs.
Intergroup Females review - Active group versus Not active group(Table 05)
The section features the comparison analysis of the two female groups (active and not-active) for
upper limbs. It is used One Way ANOVA for Dependent samples and Post ANOVA Turkey HSD Test.
The bilateral differences (right-right and left-left) for the M direction are of 2.08 cm and 4.63, values,
which are not significant at the confidence intervals 0.05 and 0.01. A significant difference of 10.79 cm
can be noticed between the two groups, on the same side (right-right), for SL direction. For upper limbs
on SL direction a difference of 5.36 cm has been obtained, which does not have a statistical significance
for the already established confidence intervals. For the IL direction, the difference of 8.37 cm is not
significant for the right-right but significant for the left-left upper limb relation (11.04 cm).
Intergroup Males review - Active group versus Not active group(Table 06)
The comparative analysis between the two groups shows insignificant differences between the
superior limbs for the left-left and right-right relations, on all three directions. The differences in the
derived results for the members on the same side range between 0.80 cm and 5.31 cm. For the
significance thresholds p<0.05 and p<0.01, these values prove the lack of the statistical significance.
Conclusion
The results derived and statistically processed prove the fact that the homogeneity of the female
groups is relative. The differences between the bilateral results under all aspects examined by UQYBT
are not significant.
Both male groups share the same relative homogeneity. The differences coming from the bilateral
UQYBT are not significant.
The comparative analysis between the active versus not-active groups proves insignificant
differences for males. For the female groups, there are insignificant differences, with a few exceptions.
There will be significant differences to benefit the active group, for the right limb (SL direction) and for
the left limb (IL direction).
The conclusion is that the closed kinetic chain of the shoulders provides stability and balance for
the subjects of both genders, to the same extent. The UQYB is a test that can be used to assess bilateral
function in a closed chain manner. The UQYBT appears to be strong related to dynamic tests involving in
mobility stability. Similarity on the UQYBT between dominant and not-dominant limbs indicates that
performance on this test using may serve as a reasonable measure for young people.
References
- Amasay, T., Hall GA, II., Shapiro, S., Ludwig, K. (2016). The Relation between Scapular Dyskinesis and the Upper Quarter Y-Balance Test. International Journal of Anatomy & Applied Physiology, 2(2) 20-25. https://www.researchgate.net/publication/308698434_The_Relation_between_Scapular_Dyskinesi s_and_the_Upper_Quarter_Y-Balance_Test [accessed Mar 2, 2017].
- Borsa, P.A., Laudner, K.G., Sauers, E.L. Mobility and Stability Adaptations in the Shoulder of the Overhead Athlete a Theoretical and Evidence-Based Perspective. Sport Medicine, 38(1), 2008, 17-36. doi: 10.2165/00007256-200838010-00003.
- Butler, R., Arms, J., Reiman, M., Phillip Plisky, P., Kiesel, K., Taylor, D., Queen, R. Sex Differences in Dynamic Closed Kinetic Chain Upper Quarter Function in Collegiate Swimmers. Journal of Athletic Training 2014; 49(4):442–446 doi: 10.4085/1062-6050-49.3.17. http://natajournals.org/doi/pdf/10.4085/1062-6050-49.3.17?code=nata-site [accessed Mar 9, 2017].
- Borms, D, Maenhout, A., Ann, M., Cools, A.M. Upper Quadrant Field Tests and Isokinetic Upper Limb Strength in Overhead Athletes. Journal of Athletic Training 2016; 51(12):000–000 doi: 10.4085/1062-6050-51.12.06. https://biblio.ugent.be/publication/8506160/file/8506165.pdf [accessed Mar 11, 2017]
- Gorman, P.P., Butler, R.J., Plisky, P.J., Kiesel, K.B. (2012). Upper Quarter Y Balance Test: reliability and performance comparison between genders in active adults. Journal of Strength and Conditioning Research, 26 (11) doi: 10.1519/JSC.0b013e3182472fdb. https://www.researchgate.net/publication/221732048_Upper_Quarter_Y_Balance_Test_reliability _and_performance_comparison_between_genders_in_active_adults [accessed Mar 2, 2017].
- Hazar, Z., Ulug, N., Yuksel, I., (2014). Upper Quarter Y-Balance Test Score of Patients with Shoulder Impingement Syndrome. Orthopaedic Journal of Sports Medicine 2014 Nov; 2(3 Suppl): doi: 10.1177/2325967114S00275. https://www.ncbi.nlm.nih.gov/pmc/articles/PMC4597741[accessed Mar 10, 2017].
- Heinbaugh, E.M., Smith, D.T, Zhu, Q., Wilison, M.A, Dai, B. The effect of time-of-day on static and dynamic balance in recreational athletes. Journal Sports Biomechanics. 14 (3), 2015, 361-373 http://www.tandfonline.com/doi/full/10.1080/14763141.2015.1084036 doi.org/10.1080/14763141.2015.1084036. [accessed Mar 10, 2017]
- Myers, H., Poletti, M., Butler, R., Functional Performance on the Upper Quarter Y-Balance Test Differs Between High School Wrestlers and Baseball Players. Journal of Sport Rehabilitation. Aug 24, 2016, 1-20. https://www.ncbi.nlm.nih.gov/labs/articles/27632876 [accessed Mar 10, 2017]
- Nenciu, G. (2014). Biomecanica. Bucharest: Editura Fundatiei Romania de Maine, 52-53.
- Park, J.Y, Chung, S.W, Jeon, S.H, et al. (2013). Clinical and radiological outcomes of type 2 superior labral anterior posterior repairs in elite overhead athletes. American Journal of Sports Medicine 44:1372-1379.
- Posea, C., Pasol, I. (2014). Anatomie. Bucharest: Editura Fundatiei Romania de Maine, 29-30.
- Robinson, CM, Hoves J., Murdoch H. et al. Functional outcome and risk of recurrent instability after primary traumatic anterior shoulder dislocation in young patients. Journal of Bone and Join Surgery. 88:1755-1763, 2006. https://scholar.google.ro/scholar?q=Robinson%2C+CM%2C+Hoves+J.%2C+Murdoch+H.+et+al[ accessed [Mar 9,2017]
- Saunders, R., Astifidis, R., Burke, S, Higgins, J., Mc Clinton, M. (2016). Hand and Upper Extremity Rehabilitation. 4th Edition. Churchill Livingstone, 266 https://books.google.com.gh/books?id=OqO3oAEACAAJ&pg=PR13&hl=ro&source=gbs_selecte d_pages&cad=2#v=onepage&q&f [accessed Mar 9, 2017].
- Sidenco, E.L. (2012). Ghid practic de evaluare mioarticulara. Bucharest: Editura Fundatiei Romania de Maine, 59-65.
- Westrick, R.B, Miller, J.M, Carow, S.D, Gerber J.P. (2012). Exploration of the y-balance test for assessment of upper quarter closed kinetic chain performance. International Journal Sports Physicals Therapy Apr; 7(2), 139-147 https://www.ncbi.nlm.nih.gov/pubmed/22530188 [accessed Mar 9, 2017]
Copyright information

This work is licensed under a Creative Commons Attribution-NonCommercial-NoDerivatives 4.0 International License.
About this article
Publication Date
12 June 2017
Article Doi
eBook ISBN
978-1-80296-023-5
Publisher
Future Academy
Volume
24
Print ISBN (optional)
-
Edition Number
1st Edition
Pages
1-91
Subjects
Sports, sport science, physical education
Cite this article as:
Sabau, E., Niculescu, G., Lupu, E., & Gevat, C. (2017). Differences On The Upper Quarter Y Balance Test Among Young People. In E. Lupu, G. Niculescu, & E. Sabău (Eds.), Sport, Education & Psychology - icSEP 2017, vol 24. European Proceedings of Social and Behavioural Sciences (pp. 51-60). Future Academy. https://doi.org/10.15405/epsbs.2017.06.7