
Multidimensional Statistical Analysis of Life Satisfaction of Older People


Abstract
The paper is devoted to a study of dependences between the life satisfaction and the social conditions of older people presented in their main scopes of life. The life satisfaction is one of the components of subjective welfare that in value judgment is interpreted as a thought-and-sense character. The life satisfaction allows estimating the influence of different life scopes of older people and outlining the priority routes of continuous welfare. It is shown that the life satisfaction of older people is ascertained using the specific questionnaire developed for the sociological inquiry. To make older people prosperous it should be known what factors promote well-being and how to provide these factors. Monitoring performs the function of collecting data about a state of the object being evaluated for further analysis. Estimation of own older person’s life in its various forms, expresses significant levels of subjective well-being, revealing the superordinate connection through the content of emotional and evaluative bases, giving multidirectional nature of the subject’s activity, which may be taken into account only at opinion poll.The paper presents the design of the three-factor space model of the nine parameters for the life satisfaction based on the methods of mathematical statistics. Within this three-factor space model, the qualitative differentiation of older people of the Tomsk region was carried out using the seven-cluster model of 400 respondents.
Keywords: Older peoplelife satisfactionwelfaremultidimensional statistical analysis (factorclusterANOVA)
Introduction
Welfare is reflected in the subjective assessment of the life satisfaction. This assessment is the integrated assessment of the available life conditions, welfare including wages, employment, material wealth, living facilities, the quality of interpersonal dealings, participation in social activity, etc. The assessment of the subjective welfare comprises the human involvement into the certain life spheres, the degree of satisfaction of what he/she has and his/her attitude to it. Being the integral parameter, the life satisfaction reflects the assessment of the external life scope. Therefore, the life satisfaction means the subjective assessment of the quality of one or another object, life conditions and activity, life as a whole, relationships between people, and people themselves including satisfaction of themselves.
This concept of the life satisfaction is widely used but is indefinite. So, in order to identify the degree of satisfaction, it is necessary to specify a sense context to the object to be assessed in which the degree of satisfaction will be measured relative to the objects to be assessed. This assessment depends on what is assessed and taken into account by the respondent. It is also necessary to account for the interaction between the welfare components.
The investigation of the satisfaction aspects implies the development of the assessing methodology allowing to obtain the imagination of the certain structural components and factors that influence the degree of satisfaction. The parameters that record the life satisfaction of older people is identified by the optimality of the living space organization that allows people to be healthy, active, capable of coping the difficulties and achieving their goals, and have a support from other people.
The problem of measuring satisfaction factors and welfare is one of the main parameter in the system of assessing the continuous welfare of older people (Ivankina et al., 2015).
A combination of statistical data and the analysis of life satisfaction that can be used to process measuring data are identified by the type of measuring scale. A sociological inquiry provides three types of measuring scales, namely: nominal (sex, residence); ordinal (estimation of satisfaction); interval (age, income). The problem of sociological measurements is the use of the quantitative interval scale along with the qualitative (nominal and ordinal) so as to solve the majority of problems of empirical sociology. This is because this scale that is used to measure such important characteristics as age, wages, etc. However, in sociological problems, the interpretation of results of the variational series is often more adequate and leads to the approximation of the interval scale of respondent’s characteristics to the ordinal or even nominal scales. Thus, the processing sociological data can be carried out using such methods of mathematical statistics as correlation, factor, dispersion, and cluster analyses.
Problem statement and research methodology
Statistical data are obtained from the sociological inquiry on concerning the problem of welfare of older people of the Tomsk region. These data are presented in Table
General distribution of respondents on life satisfaction is shown in Table
Presented in the Table
Results of the research
3.1. Factor Analysis of life satisfaction indicators
In the first place, consider the basic hypothesis of correlation life satisfaction indicators. Correlation analysis of these indicators revealed significant at different levels (Table
Significant paired correlation coefficients Spearman rank
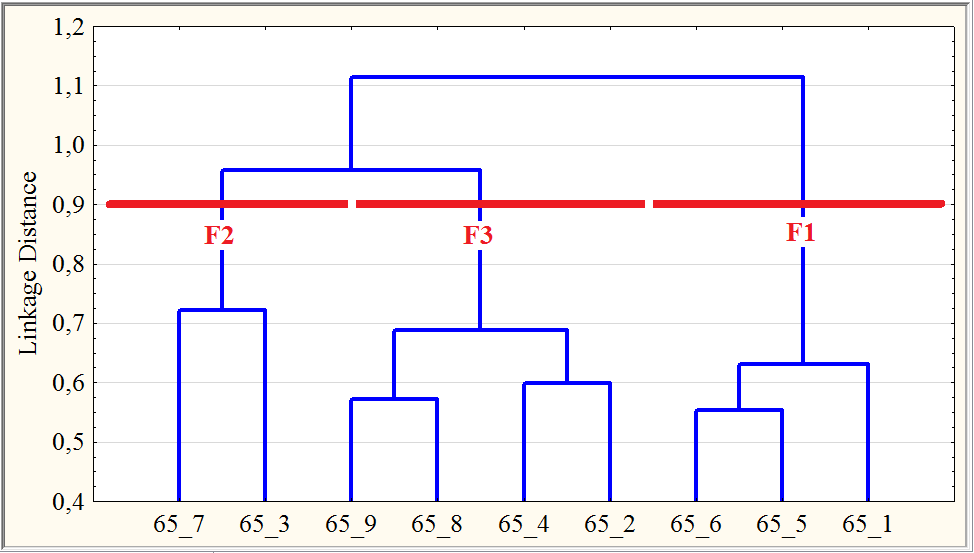
Stable with respect the amalgamation rule (methods Ward, Complete linkage) can be considered the formation of 3-correlation related indicators groups: F1 {1 + 5 + 6}, F2 {3 + 7}, F3 {2 + 4 + 8 + 9}.
Cluster analysis allows to reveal significant (1 –
Factor of life satisfaction indicators interpret Table
As a result of factor analysis of 9 initial indicators formed 3 significant factor. On the basis of factorial indicators values further research can be carried out.
3.2. Cluster analysis of the respondents
Consider the following basic hypothesis of the in homogeneities the sample of respondents collectively 3 factorial indicators, in the clustering of all respondents in the constructed factorial space {F1, F2, F3}. During the cluster analysis of the respondents were used Ward's method as a amalgamation rule and Euclidean distance as a linkage distance of the respondents.
Along with tree clustering method was applied the method of K-means conducting the classification of respondents for a given number of groups and for assessing its quality within the ANOVA. In this case, the parametric F-test shows that the difference between the 7 group means highly significant (at
In the framework of ANOVA (by multiple comparisons) can be identified for each factor homogeneous (differing insignificant at the level of significance
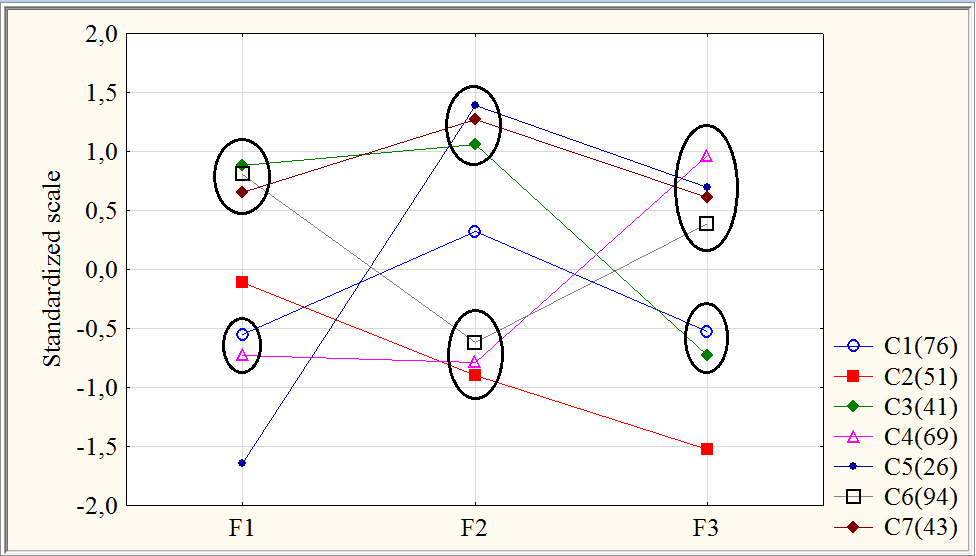
F1: {C3, C6, C7}, {C2}, {C1, C4}, {C5}. In this case C2 differs from C1 statistically significant (0.005 <p <0.050) according to parametric Tukey T-test (
F2: {C5, C7, C3}, {C1}, {C6, C4, C2}. In this case C1 differs from C3 and C6 highly significant (
F3: {C2, C1, C3}, {C5, C4}. In this case C1 differs from C2 and C6 highly significant (
Conducted clustering model allowed a qualitative differentiation of the elderly population of the Tomsk region at factor life satisfaction indicators. According to Figure
Conclusion
A multivariate statistical analysis of the life satisfaction was carried out for older people of the Tomsk region. Was constructed 3-factor model for the life satisfaction indicators based on the correlation and factor analyses of the nine initial indicators. Based on the 3-factor parameters, 400 respondents were compared, and statistically significant differences were determined for all factor parameters. Within the 3-factor space of the life satisfaction, K-means clustering and tree-clustering of 400 respondents was carried out, and the 7-cluster model was constructed for 400 respondents. The high quality of the constructed model was supported by the criteria of the ANOVA (parametricF-test and rank Kruskal–Wallis test). The statistical analysis allowed analyzing a number of hypotheses (about the correlation of parameters and inhomogeneity of respondents) and carrying out the qualitative differentiation of older people of the Tomsk region using the factor parameters of the life satisfaction.
Acknowledgements
This work was performed by the authors in collaboration with Tomsk Polytechnic University within the project in Evaluation and enhancement of social, economic and emotional wellbeing of older adults under the Agreement No.14.Z50.31.0029.
References
- Ayvazyan, S.A. & Mkhitaryan, V.S. (2001). Probability theory and applied statistics. Moscow: UNITY-DANA, 1. (in Russian)
- Borovikov, V.P. (2003). Statistica. Art on a computer analysis of the data. St.-Petersburg: Peter. (in Russian)
- Dubrov, A.M., Mkhitaryan, V.S. & Troshin, L.I. (1998). Multivariate statistical methods. Moscow: Finance and Statistics. (in Russian)
- Hill, T. & Lewicki, P. (2007). Statistics: Methods and Applications. Tulsa, OK: StatSoft.
- Ivankina, L.I. & Berestneva, O.G. (2015). Social welfare model. Modern Problems of Science and Education, 1. Retrieved from http://www.science-education.ru/121-r17571. (in Russian)
- Khalafyan, A.A. (2008). Statistica 6. Statistical analysis of the data. Moscow: Bean-Press. (in Russian)
- Monastyrny, E.A. et al. (2015). Holistic modeling of complex socio-economic and psycho-physiological effects on the example of the study of well-being of older people. Transfer of technologies – new dimension. Proc. 9th Int. Forum ‘From Science to Business’,. (in Russian)
- Soshnikova, L.A., Tamashevich, V.N., Uebe, G. & Schaefer, M. (1999). Multivariate statistical analysis in economics. Moscow: UNITY-DANA. (in Russian)
- StatSoft, Inc. (2013). Electronic Statistics Textbook. Tulsa, OK: StatSoft. Retrieved from http://www.statsoft.com/textbook.
Copyright information

This work is licensed under a Creative Commons Attribution-NonCommercial-NoDerivatives 4.0 International License.
About this article
Publication Date
17 January 2017
Article Doi
eBook ISBN
978-1-80296-018-1
Publisher
Future Academy
Volume
19
Print ISBN (optional)
-
Edition Number
1st Edition
Pages
1-776
Subjects
Social welfare, social services, personal health, public health
Cite this article as:
Ivankina, ., Mihalchuk, A., Arefiev, V., Filipenko, N., & Novoseltseva, D. (2017). Multidimensional Statistical Analysis of Life Satisfaction of Older People. In F. Casati, G. А. Barysheva, & W. Krieger (Eds.), Lifelong Wellbeing in the World - WELLSO 2016, vol 19. European Proceedings of Social and Behavioural Sciences (pp. 470-475). Future Academy. https://doi.org/10.15405/epsbs.2017.01.64