
Healthcare Efficiency as a Wellbeing Factor in the Siberian Federal District


Abstract
An assessment of the efficiency of healthcare systems in territorial entities of the Russian Federation’s Siberian Federal District was carried out using Minmax method on the basis of data presented in Unified Interdepartmental Statistical Information System. Four groups of components were assessed (presence, usage, availability of resources and medical efficiency), while being decomposed into 14 indicators. The study of selected components and indicators dynamics through 2005-2013 allowed revealing its multidirectional influence on the efficiency of healthcare systems in the Siberian Federal District territorial entities. Low or average level of efficiency was revealed in 9 out of 13 territorial entities, usually determined by the insufficient level of usage or availability of resources. Possible ways of improving the district's healthcare system efficiency were defined. It is proved that the efficiency of The Siberian Federal District healthcare systems is an essential factor in ensuring the wellbeing of the population who live in district which is distinct in uncongenial climatic-ecological conditions affecting health.
Keywords: EfficiencyhealthcareMinmax methodwellbeing
Introduction
The European Office of the World Health Organization notes that the state should give priority to healthcare, which should be considered as an investment in the future prosperity and social wellbeing (WHO, 2009). However, the increase in spending on healthcare (The World Bank, 2015; OECD, 2015) does not lead to improvement of population`s health outcomes, some of them are even becoming worse.
Morbidity of the Russian Federation's population steadily grows following the worldwide trend. Overall morbidity of country's population increased by 17.7% through 2005-2013, by 13.7% in The Siberian Federal District (Kudelina et al., 2016). The Siberian Federal District was established on 13 May 2000 of 12 territorial entities of the Russian Federation, including 4 republics; 3 krais; 5 oblasts. Its territory comes to 30% of the territory of Russia, the population is 13.2% of Russia's population and the population density is about two times lower than the average value across Russia. In 2014, the Gross Regional Product (GRP) per capita was 316.4 thousand rubles, i.e. 77.4% of the average value across the Russian Federation (408.5 thousand rubles) (FSSS, 2016).
While comparing healthcare systems in federal districts of the Russian Federation it was revealed that in The Siberian Federal District the expenditures and costs are adequate to each other from the point of view of healthcare efficiency, but it is necessary to pay rapt attention to population health indicators ("medical efficiency" component), which appear to be one of the lowest. Certainly, it is the complex climate in Siberian region, numerous plants are located on its territory, what negatively affects ecology affecting health (Kudelina, & Eremina, 2016). In addition, ecology level as well as the levels of education, housing availability, transport development and agriculture are the determinants of nation's health (ODPHP, 2016).
Methodology
A measurement of healthcare systems efficiency in territorial entities of The Siberian Federal Districts through 2005-2013 (or latest available) was conducted using Minmax (Maxmin) method with 4 components decomposed into 14 indicators.
1.
2.
3.
4.
To implement the complex analysis of healthcare practice through selected criteria an adapted method of healthcare efficiency evaluation (Eremina, & Kudelina, 2014a), which was proposed by Canadian Institute for Health Information (Barua, 2013), was used. According to research methodology, Minmax method was applied in regard to each index characterizing the following components: presence, usage, availability and medical efficiency, after that a summing up of acquired coefficients as a whole component and Minmax method was applied again to get the overall result.
Analysis of investigated components’ indexes
Provision of medical personnel in The Siberian Federal District's territorial entities differs dramatically. The highest values were recorded in Tomsk Oblast, the lowest - in Republics of Khakassia and Buryatia (61.2-57.6; 31.9-33.1 and 32.4-35.5 physicians per 10 thousand population, accordingly) (table
Number of procedures per 1 surgeon was significantly various among territorial entities, therefore, the index analysis was conducted using "average value" method. For instance, the highest surgical activity was recorded in the Republic of Altai and Kemerovo Oblast, where up to 988 and 1005 procedures were performed, respectively, the lowest activity was recorded in Tomsk Oblast and the Republic of Tuva (up to 400 and 374 procedures, table
Analysis of expenditures on medical care per 1 resident was implemented on the basis of the relation of territorial compulsory health insurance funds expenditures throughout the covered period to a number of permanent residents in a territorial entity. In all territorial entities of The Siberian Federal District through 2010-2013 the number of funds spent increased at least in 2 times: from 3.03 thousand rubles in Omsk Oblast in 2010 to 12.22 thousand rubles in Krasnoyarsk Krai in 2013 (table
The capacity of hospitals, calculated as the derivative of division of number of visits per shift multiplied by 10000 into population at the end of the year, is variable while comparing territorial entities indexes, but constant enough throughout the study period. The highest institution capacity was recorded in the Republic of Tuva - 288.2-322.4 visits per shift per 10000 population (maximum and minimum values through 2005-2013, table
The average number of hospital visits increased in all territorial entities of The Siberian Federal District from 7.1-8.2 of minimal values of visits per 1 resident though 2005-2013 to 9.9-10.4 of maximum values through 2005-2009. In the following years, it is possible to state a convergence of maximum and minimum values of the indicator: maximum values gradually decreased to initial ones as minimum ones increased by 15.5% in comparison with 2005 level (table
The level of hospitalization to 24-hour hospitals shows an extent of hospital care availability to population, however, from the other hand, the high level of hospitalization is evidence of insufficient efficiency of primary care in outpatient-polyclinic condition. The highest values throughout the whole period were recorded in the Republic of Tuva - 38.6-32.8 per 100 residents. In other territorial entities the level of hospitalization varied from 20.4 to 31.2 per 100 residents in 2005 and from 19.0 to 26.8 per 100 residents in 2013 (table
Assessment of achievement of the expected results on prevention, diagnosis, treatment, clinical examination and rehabilitation of patients was carried out using the indicators of "medical efficiency" components. Morbidity of cancer diagnosed for the first time per 100 thousand population throughout the study period increased in a varying degree, growing from 1.2% in the Republic of Altai to 59.2% in the Republic of Khakassia (table
The indicator of expected lifetime at birth characterizes a duration of life of 1 person from a generation that was born in a given year assuming that the mortality rate in each year of age would stay the same as in the year the indicator was calculated throughout the lifetime of this generation. Average expected lifetime at birth of The Siberian Federal District residents in 2013 reached 61.79-70.33 years (table
Number of days of temporary disability per 100 employees differs significantly: from a stable decline in 9 out if 12 district territorial entities (by 13.56% on average by the end of the period) to growth in three ones: in the Republics of Altai and Buryatia and in Altai Krai (by 20.46%, 8.30%, 3.89%, accordingly). The highest number of days of temporary disability in 2005, 966.5 days per 100 employees, happens to be in Tomsk Oblast, however, this index decreased by 24.54% to 729.3 days per 100 employees at the end of watch period. The lowest number of days of temporary disability is 592.5 days per 100 employees and it was recorded in 2013 in the Republic of Tuva (table
A complex assessment of components of presence, usage and availability of healthcare resources and also of medical efficiency was implemented using Minmax method (fig.
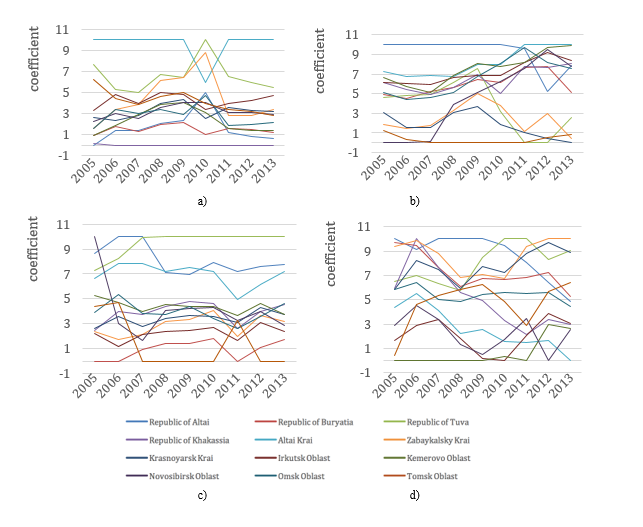
Healthcare institutions of the Republic of Altai and Altai Krai use the available resources in the best way, their overall result is generally higher than 7 points, according to Minmax method (fig.
Medical efficiency in all territorial entities throughout the study period stayed at a quite low level in Kemerovo and Novosibirsk Oblasts, where the estimated result reached 0-2.94 points and 0-4.50 points, accordingly (fig.
Discussion of results
Analysis of the dynamics of coefficients change by components and by the entire outcome allowed to reveal the features of each territorial entity of The Siberian Federal District, which determine the best or the worst indicators in comparison with other regions. Those coefficients from 7.5 to 10 points were assigned to high performance results, average performance - from 4.0 to 7.49 points and low performance - from 0 to 3.99 points. 3 territorial entities made it to the group of the best: the Republics of Tuva and Altai and also Altai Krai (fig.
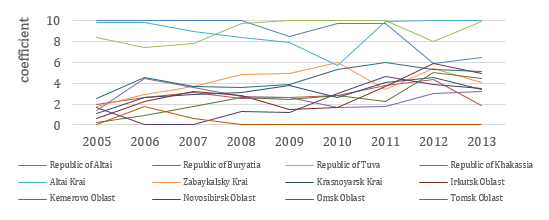
A high result in the Republic of Tuva was achieved due to high availability of healthcare resources (7.26-10.00 points, fig.
Unfortunately, the remaining 9 territorial entities of The Siberian Federal District demonstrated average and low indicators of healthcare systems efficiency, in addition, all of them shown low results in the first years of study period. Hence, the efficiency of healthcare was improved first in Omsk Oblast (due to resource usage, fig.
Conclusion
Assessment of healthcare systems efficiency of The Siberian Federal District territorial entities using Minmax method, based on the research of dynamics of 14 indexes that characterize components of presence, usage, availability of resources and also medical efficiency during active reforming and optimization of resources through 2005-2013, shows multidirectionality and uncertainty of its impact on regional healthcare. However, it is possible to reveal the components which influence the decrease of efficiency as well as its increasing.
While developing typological groups of the Russian Federation's territorial entities according to economic efficiency in actual indicators of realization of territorial programs of state guarantees on capacity and financial provision of provided medical care, no territorial entities of The Siberian Federal District were allocated to low performance group. Seven territorial entities appeared in high efficiency group (the Republics of Altai and Buryatia; Zabaykalsky and Krasnoyarsk Krais; Kemerovo, Omsk and Tomsk Oblasts), two regions were of medium efficiency (the Republic of Khakassia, Novosibirsk Oblast) and three territorial entities were allocated to below the average level - the Republic of Tuva, Altai Krai, Irkutsk Oblast (Russkikn, Sirotkina, & Tinyakova, 2016). It was ascertained that the ratio of expenditures on realization of state guarantees program to acquired outcome, calculated using Minmax method, shows that high spending does not always lead to high efficiency of regional healthcare. Low expenditures may be accompanied by high and low outcome (Kudelina, & Eremina, 2016). It is appropriate to suppose that if the financial efficiency and the provision of district territorial entities financial resources are practically assured then structural and managerial transformations are necessary for the regions with low healthcare efficiency according to Minmax method in order to eliminate disadvantages, revealed in the complex assessment of components of presence, usage, availability and provision of resources and medical efficiency.
While assessing the efficiency, it is important to take into account different aspects of such multifaceted term as "healthcare system efficiency" in relation to stakeholders: governments, institutions, healthcare organizations, medical personnel, patients and households (Eremina, & Kudelina, 2014b), what is defined by their different goals. However, only the efficiency of use of state funds for achieving certain social-economic indicators cannot be a sufficient reason to provide efficiency of a healthcare system, whose first task is to maintain population health. The equilibrium that would provide sustainable development of healthcare is possible only upon condition of balance of all regional systems components and influence of external and internal factors that define development and wellbeing of region's population. Healthcare policy, it legislation must influence on social determinants that define health (Levitsky, 2013).
The World Health Organization notes that health in the context of wellbeing should include at least the aspects of social, mental and physical health. At that, meaning (data) for each index of health should be determined, as well as various potential approaches should be tested and evaluated to the system of indicators with the introduction and interpretation of a single index (WHO, 2013a). Taking into account that the contribution of medical services provided by the health care systems is around 10-25% of health status level (Figueras et al., 2004; Wendt, 2009), the efficiency of systems of population medical care may be considered as one of the most important aspects of wellbeing of residents who live in The Siberian Federal District which is distinct in uncongenial climatic-ecological conditions affecting health.
The orientation of state policy to overcome misbalance of regional healthcare and maintenance of social solidarity and fairness would allow achieving objectives of "Health - 2020" policy. In particular: to reduce premature mortality; to increase average lifetime of the population; to decrease injustice in health (social determinants objective); to increase population wellbeing level; to provide universal coverage of healthcare services and the right to health (WHO, 2013a).
References
- Barua, B. (2013). Provincial Healthcare Index 2013. Studies in Health Policy, 1, 4-20.
- Eremina, S., & Kudelina, O. (2014a). Effectiveness of healthcare system. Regional aspect. Society and Economics, 4, 141-57. (In Russian).
- Eremina, S., & Kudelina, O. (2014b). Evaluation of Healthcare Systems Effectiveness. A Global Experience. ECO, 10, 133-46. (In Russian).
- Figueras, J., Saltman, R., Busse, R., & Dubois H. (2004). Patterns and Performance in Social Health Insurance Systems. Social Health Insurance Systems in Western Europe, 81–140.
- FSSS (2016). Federal State Statistics Service Russian Federation. Russia in figures. Retrieved from http://www.gks.ru/wps/wcm/connect/rosstat_main/rosstat/en/figures/population/.
- Kudelina, O., Eremina, S., Engelbrecht, R., & Golovkina J. (2016). Healthcare Effectiveness as a Wellbeing Factor. Workforce. The European Proceedings of Social & Behavioral Sciences,7(2), 22-30. doi:
- Kudelina, O.V. & Eremina C.L. (2016). Regional Healthcare Effectiveness. Economy of Region, 12(1), 211-225. (In Russian).
- Levitsky, S.R. (2013). Integrating Law and Health Policy. Annual Review of Law and Social Science, 9, 33-50.
- ODPHP (2016). Determinants of Health. Healthy People 2020. Retrieved from http://www.healthypeople.gov/2020/about/foundation-health-measures/Determinants-of-Health#social.
- OECD. (2016). StatExtracts. Complete databases available via OECD's iLibrary.
- Russkikn, T.N., Sirotkina N.V., & Tinyakova V.I. (2015). Rating the Efficiency of Regional Health Systems and Compulsory Health Insurance. Economy of Region, 4(44), 197-213. (In Russian).
- The World Bank. (2016). Working for a World Free of Poverty. Health expenditure, total (% of GDP).
- UISIS. (2016). Unified Interdepartmental Statistical Information System. Retrieved from http://www.fedstat.ru/indicators/start.do.
- Wendt, C. (2009). Mapping European healthcare systems: a comparative analysis of financing, service provision and access to healthcare. Journal of European Social Policy, 19, 432-45.
- WHO. (2009). Health in times of global economic crisis: implications for the WHO European Region. Meeting report.
- WHO. (2013a). The European health report 2012: charting the way to wellbeing. Retrieved from http://www.euro.who.int/en/data-and-evidence/european-health-report-2012.
- WHO. (2013b). World Health Statistics 2012.
Copyright information

This work is licensed under a Creative Commons Attribution-NonCommercial-NoDerivatives 4.0 International License.
About this article
Publication Date
17 January 2017
Article Doi
eBook ISBN
978-1-80296-018-1
Publisher
Future Academy
Volume
19
Print ISBN (optional)
-
Edition Number
1st Edition
Pages
1-776
Subjects
Social welfare, social services, personal health, public health
Cite this article as:
Kudelina, ., Eremina, S., & Kudelin, N. (2017). Healthcare Efficiency as a Wellbeing Factor in the Siberian Federal District. In F. Casati, G. А. Barysheva, & W. Krieger (Eds.), Lifelong Wellbeing in the World - WELLSO 2016, vol 19. European Proceedings of Social and Behavioural Sciences (pp. 383-395). Future Academy. https://doi.org/10.15405/epsbs.2017.01.52