
Application Of Relative Strength Index Oscillator For Equity Portfolio Construction In Malaysia


Abstract
Relative Strength Index (RSI) is one of the technical trading strategies that could help investors time their investment. This study mainly focuses on shariah and conventional stock portfolio formation for individual investors following the RSI indicator. This research aims to establish the RSI indicator and compare the performance of Islamic and conventional stock portfolios in the Malaysian market with their respective benchmark. Utilizing data collected from January 2015 until December 2019, RSI (14, 30/70) rule has been used for this study. The expected return, risk, Sharpe ratio, Jensen Alpha, and Treynor ratio were calculated for the performance analysis. The empirical results from the Malaysian market show that the RSI indicator generates a greater excess return for both shariah-compliant and conventional portfolios. Even though the return for a shariah-compliant portfolio is lower than the conventional counterpart, this strategy is still worth considering for shariah investors as it will provide a superior return as compared to the market benchmark. Although RSI is an excellent analytical tool, combining fundamental research with other technical analysis approaches can yield better results.
Keywords:
Introduction
Individual investors' involvement in the financial market has increased over the past decade in Malaysia. It has been reported that 1.9 million individuals have registered and utilized their Central Depository System (CDS) accounts as of 31st July 2018 (New Straits Times, 2018). Besides, it stated that in 2019 Bursa Malaysia has opened more than 40 percent of CDS accounts for millennials aged 25 years and below. They also highlighted that millennials were the fastest-growing account for that year (New Straits Times, 2019). In brief, there is no doubt that individual investors are becoming more interested in the Malaysian stock market.
The Malaysian government has undertaken various initiatives to encourage people to start investing in the stock market. Thus, investment knowledge is essential to people, especially new investors and youngsters. Retail investors may use various techniques to make an investment decision. These techniques could often be classified into fundamental and technical analysis.
Market timers assume that past data will influence the future market (Mohd Nor & Wickremasinghe, 2019; Yazdi et al., 2004). As a result, many of them used a technical indicator to time the market. For example, RSI is one of the technical indicators used in financial market analysis. RSI aims to measure the price momentum by analysing given security's realized profits and losses (Mohd Nor & Wickremasinghe, 2014). Indeed, it calculates the pace at which the stock price has changed over some time. Skudrna (2017) claimed one of the interesting aspects of this oscillator is that it may go down even though the price rises and vice versa. Investors use this oscillator to time their purchase or selling, and it's a straightforward method (Chong et al., 2014; Morosan, 2011; Monika & Yusniar, 2020). RSI measures how many days in the past 14 days, and it is a momentum indicator that oscillates between zero and 100 (Chong et al., 2014). Using this scale, investors can determine whether the security may be found over-purchased or oversold.
Bhargavi et al. (2017), Lee and Jais (2018), Mohd Nor and Wickremasinghe (2014), Monika and Yusniar (2020), Yazdi et al. (2004) reasserted that RSI could be used to identify overbought and oversold markets. Specifically, most of the way RSI performs is that the indicator drops when the asset's price falls and increases when the cost of the investment rises. Whenever the RSI oscillator displays a value above 70, it can be classified as overbought and indicates that security is overvalued. Koh and Fong (2003) had defined if the stock is declared to be overbought, this means a decline in the stock price. As an outcome, a sell signal is produced, and it is preferable to sell when the RSI value of the stock approaches 70 (Bhargavi et al., 2017). In contrast, when the RSI oscillator shows the value of the stock goes below or less than 30, it could be graded as oversold, and it represents that the stock price is undervalued if the stock is considered oversold, implying that the stock price will go up. As a result, it is wise to buy the stock when the RSI indicator produces a buy signal.
Problem Statement
Naturally, investors often ask two key questions: what investment are the stocks to buy, and when is the best time to buy the stock. The issues concerned selectivity skills and market timing strategy, respectively. Market analysts have mainly used two analysis methods: fundamental analysis and technical analysis. What to buy is very similar to its basic research.
Indicators are seeking to assess the optimal price point for purchase or sale, and this problem is the top priority of individual investors. Wong et al. (2003) asserted that technical oscillators such as MA and RSI might play a crucial role in timing market entries and exits. In other words, the primary function of the oscillator is to give a signal to join, i.e., when buying or selling orders and withdrawing (removing open orders) from the market. As a result, several tools are available to solve these problems, and RSI is one of the analytical tools that can help investors buy or sell the stock at the right time for their portfolio.
Although several researchers have performed RSI across various stock markets worldwide, a lack of significant studies has been conducted using RSI in the Malaysian stock market. For instance, Mohd Nor and Wickremasinghe (2014) discovered, that the MACD and RSI trading techniques might yield profitable trading in the Australian stock market. Additionally, Chen (2020) discovered that two technical analysis models (MACD and RSI) could better estimate the stock index trend, resulting in a higher return rate for investors. Furthermore, Chong et al. (2014) examined the MACD and RSI performance in the stock markets of five other OECD countries. Besides, Beaupain et al. (2010) investigated the effect of uncertainty on the interpretation of the RSI-based trading rule in the Shanghai Stock Exchange. Lastly, RSI trading rules can be utilized for both short-term and long-term investments to generate anomalous profits in Indian stock market (Bhargavi et al., 2017).
Moreover, most of the technical analysis research conducted in Malaysia typically uses other indicators, such as MA, MACD, etc., and there is a lack of study for RSI indicators independently. For reference, Mohd Nor and Wickremasinghe (2014) evaluated technical analysis and market efficiency in the Malaysian stock market during various market stages. Moreover, Ming et al. (2007) tested the random walk model and technical trading rules on the Malaysian stock exchange. Nonetheless, these studies only look at the profitability of two typical indicators: variable MA (VMA) and fixed (FMA) technical rules.
Studies on RSI oscillators are a relatively new field in the financial market in the Malaysian stock market. The RSI indicator can help forecast market fluctuations that lead to higher returns. Nevertheless, not many Malaysian investors are aware and know of this oscillator. Besides, there has been a shortage of relevant studies of RSI oscillators on the Shariah-compliant stock market. Apart from that, there is a lack of comparison between Islamic and Conventional equities using this oscillator. Therefore, the analysis is performed to discover more and explore the possibility of timing using the RSI oscillator in conventional and Shariah equities.
Research Questions
How to construct a market timing strategy based on the RSI oscillator for Islamic and Conventional equities?
What is the performance of Islamic and Conventional portfolios based on RSI?
What is the difference in stock performance between Islamic and Conventional portfolios based on RSI?
Purpose of the Study
The findings from this study have theoretical and empirical implications. For individual investors, this study will serve as a valuable guideline for managing their portfolio and investigate whether RSI is one of the indicators that can provide investors with significant profits. As there is a lack of studies that examine the RSI oscillator in a sharia-compliant stock market, this analysis will be beneficial to individual investors to know whether the RSI oscillator will give a good return or not in ICM. Since RSI focuses on stock market overbought and oversold phenomena, by understanding its presence, investors will gain a deeper insight into what investment strategies, under what conditions, on any signal in any case. As a result, individual investors will boost their stock market predictive power, enhancing their investment strategies and allowing a more detailed study of sharia-compliant equities in the Malaysian stock market. From the view of researchers, this study can serve as a basis for future studies. This study borrows the ideas from previous studies to investigate the performance of the RSI oscillator on the conventional and shariah-compliant stock.
Research Methods
The primary goal of this study is to investigate the profitability of the market timing method utilising the RSI oscillator. The study is analysed using secondary data, concentrating primarily on the FTSE Bursa Hijrah Shariah Index (FTFBMHS) and FTSE Bursa KLCI Index (FBKLCI). Such data shall consist of the daily index price from 1st January 2015 until 31st December 2019. Also, Kuala Lumpur Interbank Offered Bank (KLIBOR) will act as a risk proxy for the same period.
Relative Strength Index (RSI)
RSI is an indicator that analyses momentum in the stock price movement. Generally, momentum is the velocity of directional price movement (Carlsson & Sjgren, 2016). The RSI indicator oscillates between 0 and 100, between 70 and 30, indicating whether the asset is overbought or oversold. The 14-day RSI is a frequent length of time used by investors. Its value is determined as appears below:
Up-closes in the period t
Down-closes in the period t
The closing price for the period t
The next step is to define:
Average Gain
Average Loss
Number of RSI periods
These averages are subsequently divided to give the Relative Strength (RS):
The RSI over N periods at time t is then defined as:
The combination of the above equations and the rearrangement will result in the following:
Relative Strength Index at time t
Overbought and oversold (Buy and sell signals)
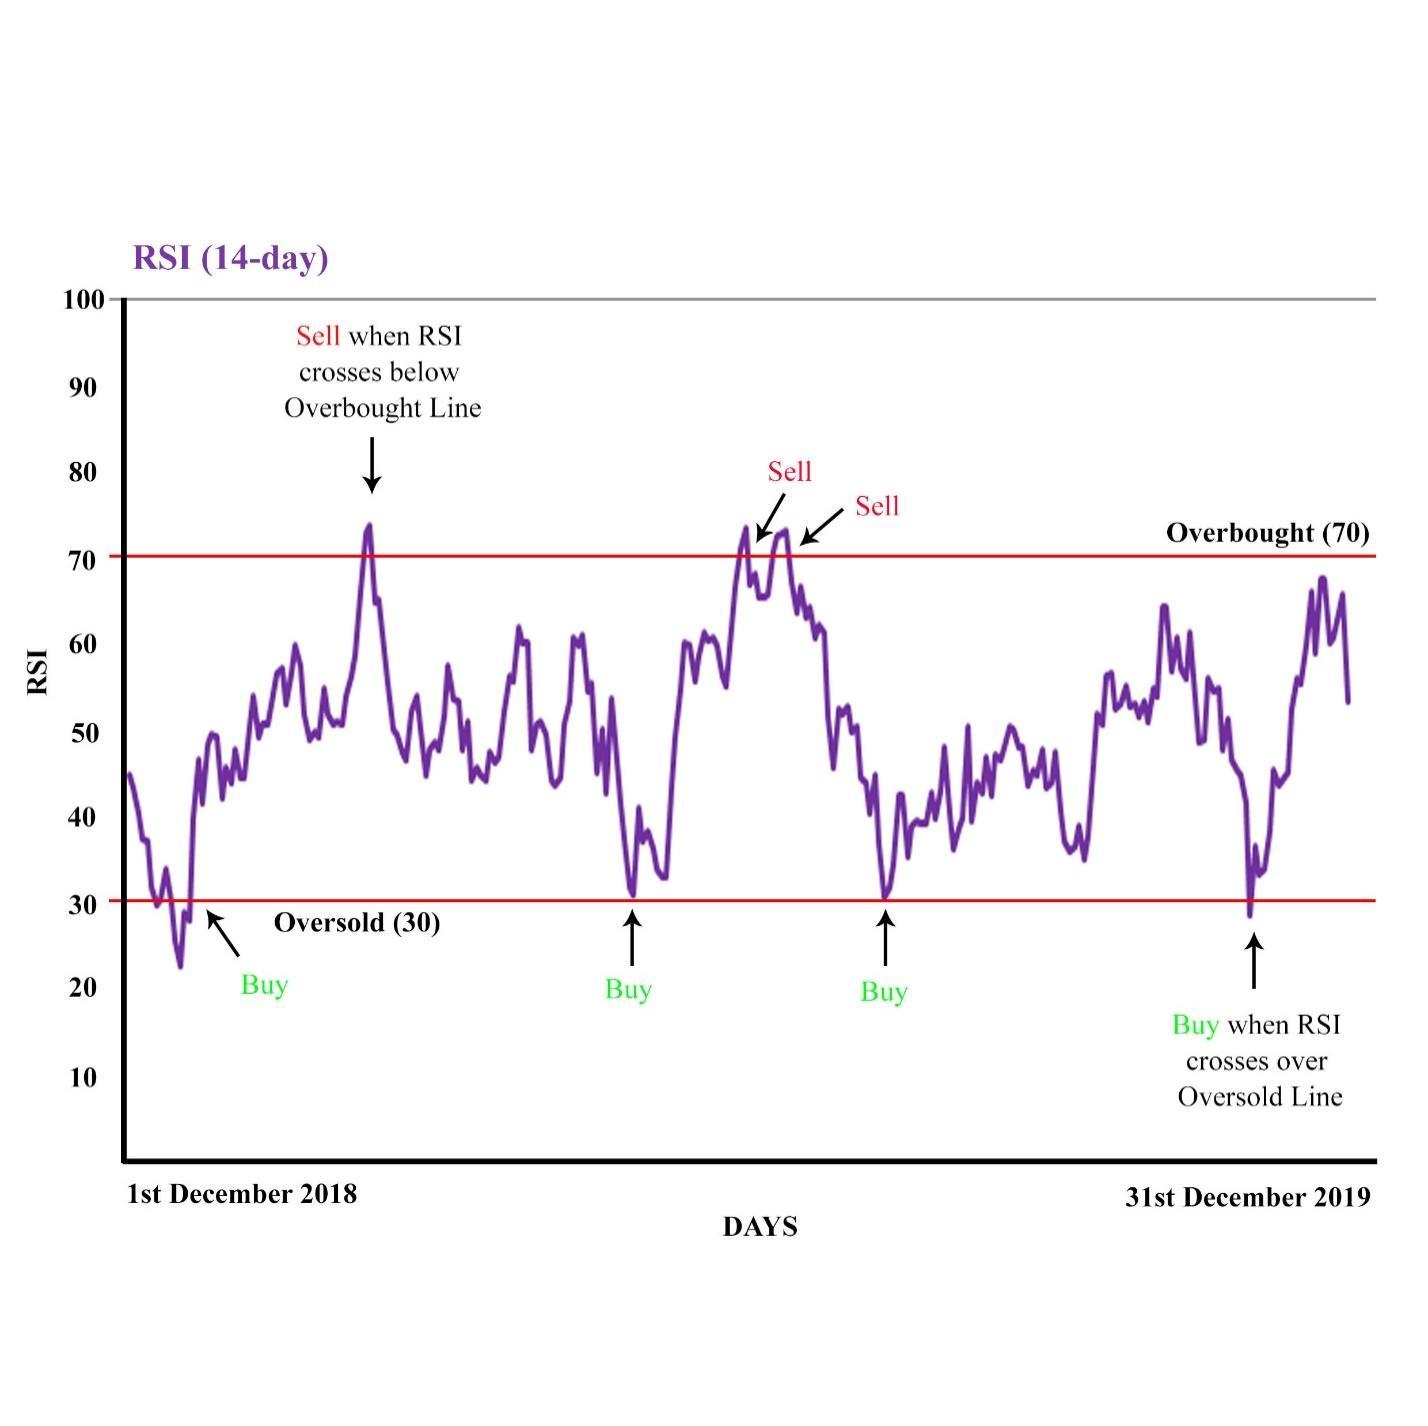
Figure 1 depicts the purchasing and selling signals in market behavior. A buy signal is received when RSI falls below the oversold line (RSI 30) and rises above 30 again, whereas a sell signal is obtained when RSI crosses over the overbought line (RSI > 70) and drops below 70 again. This trading law is known as the RSI (N, 30/70), and the RSI (14, 30/70) will be explored in this study.
Portfolio Performance Measurement
Sharpe's Ratio, devised by William F. Sharpe in 1996, is used to calculate the portfolio risk premium in relation to the portfolio's standard deviation of return. The portfolio risk premium is calculated by subtracting the overall portfolio return from the free-rate risk. By subtracting the risk-free rate from the mean return, the investors will better separate the gains associated with risk-taking behaviours. Typically, the higher the Sharpe ratio, the more attractive the risk-adjusted return. The Sharpe ratio's formula:
Rate of return of stock
Risk free rate
Treynor has developed a portfolio performance measure close to Sharpe's ratio. Treynor's Measure, however, used the portfolio beta to calculate the portfolio risk and focused solely on non-diversifiable risk. As a result, a higher ratio outcome is more favourable and means a portfolio is likely to be a more successful investment. The calculation of Treynor is determined as shown below:
Beta index of the portfolio
Jensen, in 1968 has created a portfolio performance metric that seems somewhat different from Sharpe and Treynor but technically is compatible with Treynor's measure. Jensen's measure, also named Jensen's Alpha, is based on the capital asset pricing model (CAPM), and it measures the excess return on the portfolio. The equation of Jensen Alpha is as follows:
Market return
Findings
The daily data from 2015 until 2019 are utilized to carry out market timing strategy using RSI rules (14,70,30). The analysis will depict the number of buy or sell signals, the performance of the top 10 constituents' companies of both indexes, and the comparison of the Islamic index and the conventional index, namely, FBMHS and KLCI, respectively.
For conventional and shariah portfolios, there has been some variation in the movement of RSI values. The inspection period is 14 days long, and the RSI is usually set at 30-70 points. If the RSI is below 30, it is oversold, and a buy signal is issued; if it is above 70, it is overbought, and a sell signal is generated. Thus, there's a slight difference between both portfolios' sell and buy signals. As seen in Figure 2 below:
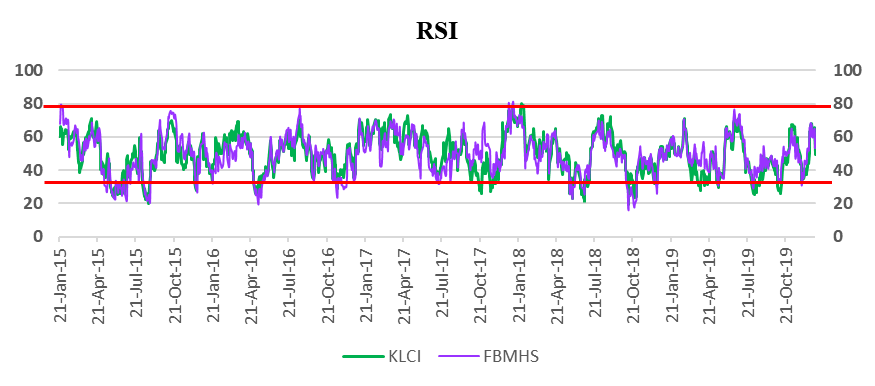
Table 1 shows the number of buys and sells signals for conventional and shariah portfolios. KLCI generated 76 buy signals and 38 sell signals. In contrast, FBMHS produced 79 buy signals and 52 sell signals. However, the investor will hold the stock they bought until the next sell signal is generated. Thus, only five buy and sell signals are considered in constructing a conventional portfolio. At the same time, four purchase and sell signals are used in the shariah portfolio. The market timing for both traditional and shariah portfolios is shown in Table 2.
The RSI (14, 30/70) rule from the study can be used by individual investors to time the market as they want. The effectiveness of the conventional and shariah portfolios using the RSI indicator was calculated based on the profitability of the buy and sell signals. The annualized risk and return show many differences for both perspectives as an individual investor for conventional and shariah are performing portfolio. In Table 3, the highest loss for a particular investor can get -8.3214% for KLCI and -9.7384% for FBMHS. It shows that both market portfolios are negative in mean return. However, both portfolios using the RSI indicator are more significant than the market return and do not indicate a loss.
The RSI trading rule is a powerful oscillator for retail investors to earn profitable trading for conventional and shariah portfolios. This study used the 14 days length of the inspection period and RSI generated at the level of 30-70 points or RSI (14, 30/70). The buy and sell signals exceed the unconditional mean returns in most cases, and this performance is better for the KLCI portfolio. Based on the findings, conventional and shariah portfolios give profitable investment using RSI (14, 30/70) rule. Both portfolios show the bright side because both are outperforming the benchmark; however, the KLCI portfolio gives a higher mean or is more profitable than shariah.
The conventional portfolio's Sharpe ratio is more profitable than the shariah portfolio. KLCI portfolio gives the highest return per portfolio risk, with a total of 0.5448 over the five years, while the FBMHS portfolio gives a ratio of -0.1095 of return over its portfolio risk. It means that KLCI is better at risk-adjusted across all stocks invested than the FBMHS portfolio. Even the risk of both portfolios is almost the same, but the value above shows that the KLCI portfolio is riskier compared to the FBMHS portfolio with 0.1689 and 0.1654. This outcome indicates that the higher standard deviation doesn't mean it will affect the lower Sharpe ratio. Besides, the average portfolio returns show that KLCI returns 12.38%, which is almost 8% higher than the FBMHS portfolio, 1.37%. Thus, a higher average excess return gives a higher Sharpe ratio. Therefore, the market Sharpe ratio gives a negative value, and this can be interpreted as the market return is lower than the risk-free return.
However, both portfolios show that both portfolios can give an excess return, especially the KLCI portfolio with 0.5448, which is greater than the market KLCI index's Sharpe ratio, -0.7288. Even though the FBMHS portfolio's Sharpe ratio is negative, it still gives excess return since -0.1095 is higher than the market Sharpe ratio of FBMHS, -0.8091. It shows that the investors can still gain an excess return from the investments even in the slowdown market.
The Treynor ratio of the conventional portfolio is more suitable for investment compared to the shariah portfolio. KLCI portfolio gives the highest return per portfolio beta, with a total of 21.9714% over five years, while for FBMHS portfolio gives a ratio of -1.9024% of return over its portfolio risk. This result shows that the shariah portfolio is better at risk-adjusted to systematic risk than the shariah portfolio.
The result shows that the FBMHS portfolio market beta is 0.95, higher than KLCI, 0.42. Therefore, it indicates that the shariah portfolio is more volatile than the conventional portfolio. This matter demonstrates that higher beta affects the lower Treynor ratio. Meanwhile, the average portfolio returns show that KLCI gives a return of 12.38%, which is almost 10% higher than FBMHS, which values 1.37%. Therefore, a higher average excess return also provides a higher Treynor ratio. However, these results indicates that both portfolios can give excess return even in systematic risk because the Treynor ratio for the conventional and shariah portfolio is higher than the market Treynor ratio, which is -11.502% for KLCI's Treynor ratio and -12.924% for FBMHS's Treynor ratio. Thus, it shows that the investors are still able to gain an excess return from the investments even in the systematic risk.
Jensen Alpha in both portfolios is more significant than the Jensen alpha market; 0.0208% (KLCI) and 0.0229% (FBMHS), both greater than 0%. These suggest that both portfolios have received more than adequate returns to cover the year-over-year risk. Besides, on a risk-adjusted basis, both portfolios have overperformed the market. While this may be accurate, the shariah portfolio is more favourable due to a higher value of 0.002% of Jensen Alpha over the five years relative to the conventional portfolio. For investors, a higher alpha is often attractive.
From performance perspective, conventional portfolio is more profitable than shariah portfolio. As the majority of companies are blue-chip companies, the KLCI portfolio tends to receive a higher return or more stable profit than the shariah portfolio. However, the research shows that, despite the slowdown on the market, investment in the shariah-compliant stock portfolio can also produce revenue and minimize the loss. The findings from this study appear to confirm the RSI indicator's profit potential for conventional and shariah portfolios. Moreover, it can also provide significant gains in the most recent subperiod.
Overall, the results show that the portfolios could give an excess return even if the KLCI and FBMHS are slow down. Therefore, the investor should use the RSI indicator with RSI (14,30/70) rule for market timing strategy because it may result in an excellent performance in the portfolio. In a nutshell, investors need to concern about any unpredictable events that may happen unexpectedly to stocks that would like to invest the most. Even so, investors are still required to review the stock's capabilities for the future in advance by investing stocks in the portfolio.
Conclusion
The RSI indicator is one of the technical analysis techniques that can be applied as a market timing strategy for individual investors to earn investment profits. In other terms, the stock can be invested based on the market timing of the RSI. The RSI (14,30/70) rule determines whether the stock is over-purchased or over-sold. If the RSI value is 30 and below, it is classified as oversold, while if it is 70 and above, it might be considered oversold. With this value, the RSI indicator will produce signals to buy and sell. This analysis shows that the RSI indicator with the RSI (14,30/70) rule can be profitable for conventional and Shariah portfolios. In addition, using this RSI oscillator efficiently reduces the volatility of the stock portfolio.
Furthermore, this study proved that RSI (14,30/70) indicators could be used to construct the portfolio. The stock selection has been optimized for sample allocation with the results of the RSI indicator before. Besides, the risk and return of conventional and shariah-compliant portfolios have been measured, indicating the RSI indicator's performance. The result shows the individual investors can earn profit using RSI (14,30/70) rules for both portfolios. Lastly, this study has compared the performance of the market timing strategy for the conventional and Islamic stock markets. In a nutshell, these strategies can be used by the individual investor because it is very valuable and worth predicting the market. It is suitable for each investor to participate in Shariah-compliant investments, as they can achieve profit properly, which is an Islamic concept.
Many strategies can be used in investing, and the RSI indicator is one of the ways. To prevent losses for retail investors due to the wrong timing of the purchase or selling of shares in a portfolio, RSI can be one of the analytical tools that can give them the confidence to enter and exit the market at the right time. Moreover, RSI can forecast the future price by providing buy and sell signals for investors. Hence, this research will shed light on the profitability of RSI, specifically for shariah-compliant equities. The findings could imply that the Malaysian stock market is inefficient in its weak form.
Recommendation
There is still a lot of attention required in this research to enhance the study's weaknesses. It is suggested to try to use diverse stocks such as mid-cap and small-cap to improve the study's predictability for future research. In addition, the data in this study is limited to only five years; if the study can collect the data for a more extended period, the results will be more precise. Furthermore, the study aims to guide investors in selecting stocks and market timing. Bond investments are also suggested when no buy and sell signals are produced. It can give higher returns with the bond because it is safer or less risky than the stock market. The transaction cost also should be included in the future study, reflecting the investor's actual returns. The results' robustness can be seen if more research includes realistic constraints such as trading expenses and short-selling or short-selling limits. Although the RSI is an effective analytical tool, combining it with fundamental analysis and other technical analysis techniques can yield superior results.
References
Beaupain, R., Meng, L., & Belair, R. (2010). The impact of volatility on the implementation of the relative strength index: evidence from the Shanghai stock exchange. Insurance Markets and Companies: Analyses and Actuarial Computations 1(3), 73–78.
Bhargavi, R., Gumparthi, S., & Anith, R. (2017). Relative strength index for developing effective trading strategies in constructing optimal portfolio. International Journal of Applied Engineering Research, 12(19), 8926–8936.
Carlsson, C., & Sjgren, T. (2016). Profiting from serial correlation Constructing a trading strategy on the DAX. https://www.diva-portal.org/smash/record.jsf?pid=diva2%3A1131389&dswid=6541
Chen, Y. (2020). Stock Technical Analysis by Using MACD & RSI Indicators.
Chong, T., Ng, W.-K., & Liew, V. (2014). Revisiting the Performance of MACD and RSI Oscillators. Journal of Risk and Financial Management, 7(1), 1–12. DOI:
Koh, B., & Fong, W. M. (2003). Personal Financial Planning (3rd ed.). Pearson Education South Asia Pte Ltd.
Lee, Y. M. K., & Jais, M. (2018). Effectiveness of Technical Analysis Signals Around the Earning Announcements in Malaysian Stock Market. International Journal of Engineering & Technology, 7(3.21), 109. DOI:
Ming, L. M., Guru, B. K., & Nor, F. M. (2007). An Examination of The Random Walk Model and Technical Trading Rules in The Malaysian Stock Market. Malaysian Accounting Review, 6(2), 99-121.
Mohd Nor, S., & Wickremasinghe, G. (2014). The profitability of MACD and RSI trading rules in the Australian stock market. Investment Management and Financial Innovations, 11(4), 194–199.
Mohd Nor, S., & Wickremasinghe, G. (2019). Market efficiency and technical analysis during different market phases: further evidence from Malaysia. Investment Management and Financial Innovations, 14(2), 359–366.
Monika, N. E., & Yusniar, M. W. (2020). Analisis Teknikal Menggunakan Indikator MACD dan RSI pada Saham JII. Jurnal Riset Inspirasi Manajemen Dan Kewirausahaan, 4(1), 1–8. DOI:
MoroSan, A. (2011). The relative strength index revisited. African Journal of Business Management, 5(14), 5855–5862.
New Straits Times. (2018, September 6). Bursa Malaysia provides growth opportunity in a regulated environment. https://www.nst.com.my/business/2018/09/408893/bursa-malaysia-provides-growth-opportunity-regulated-environment
New Straits Times. (2019, August 5). More millenials investing in the stock market. https://www.nst.com.my/business/2019/08/510296/more-millenials-investing-stock-market
Skudrna, J. (2017). Comparative analysis of technical indicators in international equity markets. https://utheses.univie.ac.at/detail/40816
Wong, W. K., Manzur, M., & Chew, B. K. (2003). How rewarding is technical analysis? Evidence from Singapore stock market. Applied Financial Economics, 13(7), 543–551. DOI:
Yazdi, S. H. M., Lashkary, Z. H., & Ismail, I. (2004). Technical analysis of FOREX by RSI Indicator. https://www.academia.edu/8378078/Technical_analysis_of_FOREX_by_RSI_Indicator
Copyright information

This work is licensed under a Creative Commons Attribution-NonCommercial-NoDerivatives 4.0 International License.
About this article
Publication Date
31 October 2022
Article Doi
eBook ISBN
978-1-80296-958-0
Publisher
European Publisher
Volume
3
Print ISBN (optional)
-
Edition Number
1st Edition
Pages
1-802
Subjects
Multidisciplinary sciences, sustainable development goals (SDG), urbanisation
Cite this article as:
Khairudin, S., Elias, S. M., Kamil, K. H., & Ahmad Chukari, N. (2022). Application Of Relative Strength Index Oscillator For Equity Portfolio Construction In Malaysia. In H. H. Kamaruddin, T. D. N. M. Kamaruddin, T. D. N. S. Yaacob, M. A. M. Kamal, & K. F. Ne'matullah (Eds.), Reimagining Resilient Sustainability: An Integrated Effort in Research, Practices & Education, vol 3. European Proceedings of Multidisciplinary Sciences (pp. 33-43). European Publisher. https://doi.org/10.15405/epms.2022.10.4